
StatPecker
StatPecker uses AI to analyze data and create instant, shareable insights and infographics from your CSV files.
tool Details
Explore More
Alternatives

About StatPecker
StatPecker is an advanced AI-powered data visualization and storytelling platform designed to convert raw and unstructured data into visually appealing, publication-ready infographics in a matter of seconds. This innovative platform serves as an automated alternative to traditional report generation methods, significantly reducing both time and financial costs associated with data communication. StatPecker democratizes data visualization, making sophisticated graphical representations accessible to users without technical expertise in complex spreadsheet tools or graphic design software. The platform is tailored for a diverse range of users, including content creators, journalists, data analysts, researchers, marketing professionals, business strategists, educators, and students. By leveraging artificial intelligence, StatPecker empowers users to extract instant insights from both natural language queries and structured CSV data files. Users can simply upload datasets, ask questions in plain language, and receive accurate, visually engaging outputs that can be downloaded, published, or seamlessly embedded into digital content. This streamlining of the workflow from data analysis to visual presentation enhances the clarity and impact of data-driven narratives across various applications such as reports, articles, campaigns, and educational materials.
Features
Ask Your Query
StatPecker allows users to obtain instant insights by querying data in natural language. This feature eliminates the need for complex tools, enabling users to simply ask questions and receive validated answers quickly and efficiently.
Publish & Embed
With StatPecker, users can make their visuals interactive and easily integrate them into blogs, articles, and websites. This feature ensures that data storytelling is not only engaging but also accessible to a wider audience.
Upload & Analyze CSVs
Users can upload CSV files of up to 50 MB and conduct analyses without the hassle of traditional spreadsheet software. This feature allows for local analysis, ensuring that sensitive data remains private and secure while providing insightful visualizations.
Download & Use Anywhere
StatPecker facilitates the export of infographics as images, which can be utilized in reports, presentations, and more. This flexibility allows users to leverage their visual data storytelling across various formats and platforms.
Use Cases
Content Creation
Content creators can leverage StatPecker to transform complex data into visually appealing infographics that enhance their articles and blog posts. This capability allows for improved audience engagement and comprehension of data-driven narratives.
Market Research
Researchers and analysts can use StatPecker to quickly visualize market trends and comparisons. By uploading CSV files and asking targeted questions, they can extract insights that inform strategic decisions and business planning.
Educational Applications
Educators and students can utilize StatPecker to create compelling visual aids for presentations and assignments. The ability to produce professional-quality infographics quickly enhances the learning process and facilitates better communication of ideas.
Marketing Campaigns
Marketing professionals can employ StatPecker to generate visually engaging content for campaigns. By leveraging instant insights and interactive visuals, they can effectively communicate key messages and data to their target audiences.
Frequently Asked Questions
How does StatPecker ensure data privacy?
StatPecker utilizes a local SQL agent for on-device analysis, meaning that data uploaded by users remains on their devices and is not shared with external servers. This approach prioritizes user privacy and data security.
Can I use StatPecker for free?
Yes, StatPecker offers a free tier that allows users to create unlimited projects and embeds, conduct a limited number of AI queries, and upload CSV files. This tier provides a cost-effective way to access essential features of the platform.
What types of files can I upload to StatPecker?
Users can upload structured CSV files of up to 50 MB for analysis. This functionality allows users to extract insights from their data without the complexity of traditional spreadsheet software.
Is there customer support available?
StatPecker provides customer support through various channels, ensuring that users can receive assistance with any inquiries or issues they may encounter while using the platform.
Similar to StatPecker
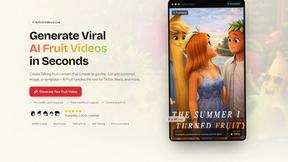
AI Fruit
Generate viral AI fruit videos in seconds — talking fruit, ASMR cuts, and surreal hybrids.


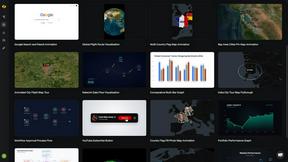
Easymotion - AI Motion Graphic Generator
AI motion graphics and map animation generator for content creators, editors, founders and marketers.

Reelry
Reelry transforms your website into consistent, on-brand TikTok reels by automatically ideating, scripting, and producing content in your unique.

EnsembleData
EnsembleData provides real-time, scalable APIs for extracting posts, profiles, comments, and analytics from social media platforms.
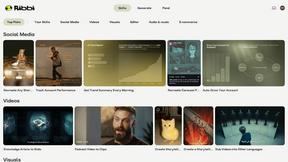
Ribbi
Ribbi is a self-evolving AI agent that automates and enhances your social media content creation and performance tracking.

ytZolo
ytZolo is an AI-powered platform that generates viral YouTube thumbnails, SEO titles, scripts, and descriptions using ChatGPT, Claude, and Gemini.