Dividend Data vs Moon Banking
Side-by-side comparison to help you choose the right tool.
Dividend Data
Dividend Data delivers automated stock data, including dividends and financials, directly into your Google Sheets or Excel spreadsheets.
Last updated: March 11, 2026
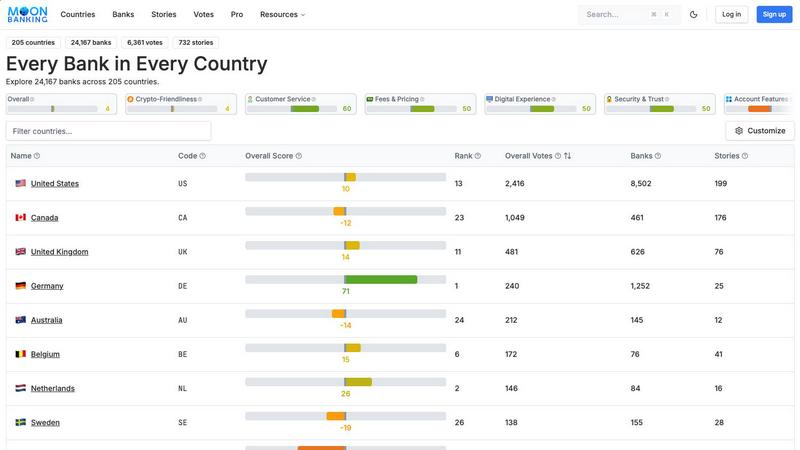
Moon Banking
Moon Banking offers comprehensive global bank data with AI-native integrations for analysts, marketers, and developers.
Last updated: February 26, 2026
Visual Comparison
Dividend Data

Moon Banking
Feature Comparison
Dividend Data
Comprehensive Spreadsheet Integration
The platform provides seamless integration with both Google Sheets and Microsoft Excel via dedicated add-ins. Users access data through 16+ custom functions, such as DIVIDENDDATA_DIVIDENDS, DIVIDENDDATA_RATIOS, and DIVIDENDDATA_QUOTE. These functions allow for dynamic, live data retrieval directly into spreadsheet cells, transforming static sheets into powerful, auto-updating analysis tools. The integration requires no coding, maintaining the familiar spreadsheet environment while supercharging its capabilities with professional data feeds.
Extensive Historical & Fundamental Data Library
Dividend Data grants instant access to a deep historical database covering 30+ years of market data. This includes not only dividend history and forward-looking metrics but also complete fundamental data: income statements, balance sheets, cash flow statements, and over 100 key financial ratios (e.g., P/E Ratio, Debt-to-Equity). The coverage of 80,000+ tickers ensures data is available for a vast array of global stocks, ETFs, and other securities, supporting thorough historical trend analysis and comparative fundamental research.
Dividend-First Analytical Functions
Tailored specifically for income investors, the tool offers specialized functions that output critical dividend metrics. Users can retrieve forward annual dividends, forward dividend yields, next ex-dividend dates, payout ratios, and dividend growth rates with single formulas. This focused feature set allows for rapid screening, yield calculation, and sustainability analysis directly within a portfolio model or research sheet, streamlining the workflow for constructing and monitoring dividend growth portfolios.
Free Tier with Generous Monthly Credits
A key differentiator is the sustainable free access model. The platform offers a permanent free tier that provides 2,500 credits per month without trial expiration or credit card requirements. This allows users to perform substantial monthly analysis, such as pulling data for hundreds of stock queries, at zero cost. This model lowers the barrier to entry for individual investors and provides real utility before any upgrade consideration.
Moon Banking
MCP Server Integration
Moon Banking's MCP server provides seamless integration with popular large language models like ChatGPT, Claude, and Gemini. This feature allows users to engage in natural language conversations to access and analyze global bank data intuitively, making information retrieval efficient and user-friendly.
OpenClaw Skill
The OpenClaw Skill is a native capability for OpenClaw agents that simplifies interactions with the Moon Banking API. Available on ClawHub, this feature allows AI agents to execute straightforward curl commands to access the vast bank dataset, enhancing their ability to respond to user inquiries and deliver relevant banking insights.
Developer-First API & SDKs
Moon Banking is equipped with a modern API and Software Development Kits (SDKs) designed specifically for the AI economy. This feature enables developers to build applications that harness the extensive bank data available on the platform, facilitating the creation of innovative financial tools and services.
Comprehensive Bank Dataset
With detailed information on thousands of banks, Moon Banking provides users with extensive insights into various banking metrics, including fees, customer service ratings, security features, and digital experiences. This comprehensive dataset allows users to make informed decisions and assessments regarding banking options globally.
Use Cases
Dividend Data
Automated Dividend Portfolio Tracking
Investors can build a dynamic dividend portfolio tracker in their preferred spreadsheet. By using formulas like DIVIDENDDATA_DIVIDENDS to pull yield and payment data for each holding, the portfolio sheet can automatically calculate projected annual income, portfolio yield, and track ex-dividend dates. This eliminates manual data entry and ensures the portfolio dashboard always reflects the latest declared dividends and share prices.
Fundamental Stock Screening and Analysis
Analysts and investors can create custom stock screens using the live data functions. By building a sheet with columns for various metrics (e.g., P/E ratio, dividend yield, payout ratio, EPS growth), users can paste a list of tickers and instantly populate a comparable analysis matrix. This facilitates rapid identification of stocks meeting specific fundamental criteria, such as those with a yield above 3%, a P/E below 20, and a payout ratio under 60%.
Historical Financial Performance Research
For deep-dive research on a specific company, users can construct multi-year financial models. Formulas can pull 10+ years of annual revenue, net income, EPS, and dividend per share data into adjacent columns, enabling the creation of charts and the calculation of compound annual growth rates (CAGR) for critical financial metrics. This supports thorough due diligence on a company's long-term financial health and dividend growth trajectory.
Educational Modeling and Backtesting
Students and investing enthusiasts can use the historical price and dividend data to build educational models. For instance, they can create a sheet to backtest a dividend reinvestment plan (DRIP) strategy by pulling historical prices and dividend dates to simulate growth over time. This hands-on access to real historical data provides a practical tool for learning about equity analysis and portfolio mechanics.
Moon Banking
Financial Analysts
Financial analysts can utilize Moon Banking to develop AI-powered research tools that employ natural language queries to uncover unique market opportunities. By accessing real-time data about banks, they can provide deeper insights and analysis in their reports, enhancing the quality of their financial recommendations.
Bank Marketers
Bank marketers can leverage Moon Banking's extensive dataset to identify potential prospects and analyze competitive positioning within the banking sector. The platform's AI-powered insights facilitate the development of targeted outreach strategies, allowing marketers to optimize their campaigns based on data-driven decisions.
App Developers
App developers can integrate Moon Banking's accurate bank data into their applications. This capability allows the creation of comparison tools, banking finders, and review platforms, helping consumers make informed banking choices based on comprehensive data analysis.
International Banking Consultants
International banking consultants can employ Moon Banking to evaluate and compare banks across different countries. The platform's extensive dataset enables them to assess international banking conditions, fees, and services, providing valuable insights for clients looking to expand their banking operations globally.
Overview
About Dividend Data
Dividend Data is a specialized financial data platform engineered to provide institutional-grade stock market intelligence directly within the workflow of fundamental and dividend investors. Its core product is a powerful spreadsheet add-in for Google Sheets and Microsoft Excel that eliminates the traditional barriers to accessing deep financial data. The platform delivers over 30 years of historical and real-time data for more than 80,000 global tickers through a suite of simple, custom spreadsheet formulas. Users can instantly pull critical metrics such as dividend amounts, yields, payout ratios, growth rates, complete financial statements, earnings data, valuation ratios, and price history without requiring API keys, coding knowledge, or manual copy-pasting from external sources. Built by a dividend investor for the community, Dividend Data distinguishes itself with a permanently free tier offering 2,500 monthly credits, robust functionality across both major spreadsheet ecosystems, and a focus on the specific data points that income-focused and value investors need to make informed decisions. It is designed for individual investors, financial analysts, and portfolio managers who demand comprehensive, reliable data but seek to avoid the complexity and high cost typically associated with professional financial data terminals.
About Moon Banking
Moon Banking is an innovative AI-powered global banking intelligence platform designed to provide real-time, accurate data about banks worldwide. By leveraging advanced artificial intelligence techniques, it eliminates the issue of AI hallucinations, ensuring users receive precise and reliable information. The platform boasts the largest bank dataset ever compiled, encompassing comprehensive details about over 24,000 banks across 205 countries. Moon Banking is tailored for various users, including financial analysts seeking to enhance their research capabilities, bank marketers aiming to refine their outreach strategies, and app developers looking to integrate robust banking data into their applications. With its cutting-edge features and deep insights, Moon Banking transforms how users interact with and understand global banking dynamics.
Frequently Asked Questions
Dividend Data FAQ
What data can I access with the free tier?
The free tier provides full access to all of Dividend Data's 16+ custom functions and the entire database of over 80,000 tickers and 30+ years of history. Your usage is limited by a monthly credit allowance of 2,500 credits. Each data point retrieved (e.g., one cell with a price, a dividend yield, an EPS figure) typically consumes one credit. This allows for hundreds to thousands of data points per month, suitable for substantial personal analysis and portfolio tracking.
How does the spreadsheet add-in get installed?
For Google Sheets, you install the "Dividend Data" add-on directly from the Google Workspace Marketplace. For Microsoft Excel, you install the "Dividend Data" add-in from the Microsoft AppSource store within Excel. Both processes are straightforward, following the standard installation flow for each platform. Once installed, the custom functions become available in your spreadsheet, and you can start using them immediately after a quick account sign-up.
Is the data provided live and real-time?
The data is live and reflects the most recent information available from Dividend Data's providers. For market quotes like stock price, it is typically real-time or delayed based on the data feed. Fundamental data, such as financial statements and dividends, is updated as soon as the information is publicly released and processed. The average response time for a data request is 0.84 seconds, ensuring your spreadsheets update quickly.
Do I need to know how to code or use APIs?
No coding or API knowledge is required. Dividend Data is designed specifically to be a no-code solution. All data integration is handled through simple, pre-built spreadsheet formulas that work identically to native functions like SUM() or VLOOKUP(). You only need to know the ticker symbol and the metric code (provided in the documentation) to retrieve any data point.
Moon Banking FAQ
What is the primary purpose of Moon Banking?
Moon Banking aims to provide accurate, real-time banking data through advanced AI integrations, helping users make informed decisions in the global banking landscape.
How does Moon Banking ensure data accuracy?
The platform leverages a vast dataset compiled from numerous sources and employs advanced AI algorithms to eliminate inaccuracies and provide reliable bank information.
Can developers access the Moon Banking API?
Yes, Moon Banking offers a developer-first API and SDKs that allow developers to integrate comprehensive banking data into their applications easily.
Who can benefit from using Moon Banking?
Moon Banking is beneficial for financial analysts, bank marketers, app developers, and international banking consultants looking for accurate and extensive banking insights.
Alternatives
Dividend Data Alternatives
Dividend Data is a specialized financial data add-on for Google Sheets and Microsoft Excel, falling into the category of fundamental and dividend investment analysis tools. It provides direct spreadsheet integration for historical dividend data, financial statements, and key metrics without requiring programming skills or API management. Users may explore alternatives for various reasons, including specific budget constraints, the need for different data points like options or macroeconomic indicators, integration with other platforms such as trading software, or a preference for a standalone desktop application rather than a spreadsheet add-on. The core requirement often remains consistent: reliable, historical financial data to inform investment decisions. When evaluating an alternative, key considerations should include the depth and historical range of the dividend dataset, the total cost relative to your data consumption, the ease of integration with your existing workflow, and the breadth of supplementary fundamental metrics offered, such as financial ratios and earnings data.
Moon Banking Alternatives
Moon Banking is an advanced AI-powered global banking intelligence platform that consolidates the largest bank dataset available. It is designed for analysts, marketers, developers, and institutions, providing real-time, accurate data through various AI-native integrations. As users seek to enhance their banking insights and capabilities, they often explore alternatives to Moon Banking due to factors such as pricing, feature sets, and specific platform needs that may align better with their operational requirements. When searching for an alternative, it's crucial to evaluate the comprehensiveness of the banking dataset, the flexibility of integration options, and the usability of the platform. Consider whether the solution offers tailored features that cater to your specific use case, such as data analytics, API accessibility, or support for AI-driven applications. Additionally, assess the overall cost-effectiveness and whether the alternative meets the scalability and performance expectations of your business.