Dividend Data
Dividend Data delivers automated stock data, including dividends and financials, directly into your Google Sheets or Excel spreadsheets.
tool Details
Explore More
Alternatives

About Dividend Data
Dividend Data is a specialized financial data platform engineered to provide institutional-grade stock market intelligence directly within the workflow of fundamental and dividend investors. Its core product is a powerful spreadsheet add-in for Google Sheets and Microsoft Excel that eliminates the traditional barriers to accessing deep financial data. The platform delivers over 30 years of historical and real-time data for more than 80,000 global tickers through a suite of simple, custom spreadsheet formulas. Users can instantly pull critical metrics such as dividend amounts, yields, payout ratios, growth rates, complete financial statements, earnings data, valuation ratios, and price history without requiring API keys, coding knowledge, or manual copy-pasting from external sources. Built by a dividend investor for the community, Dividend Data distinguishes itself with a permanently free tier offering 2,500 monthly credits, robust functionality across both major spreadsheet ecosystems, and a focus on the specific data points that income-focused and value investors need to make informed decisions. It is designed for individual investors, financial analysts, and portfolio managers who demand comprehensive, reliable data but seek to avoid the complexity and high cost typically associated with professional financial data terminals.
Features
Comprehensive Spreadsheet Integration
The platform provides seamless integration with both Google Sheets and Microsoft Excel via dedicated add-ins. Users access data through 16+ custom functions, such as DIVIDENDDATA_DIVIDENDS, DIVIDENDDATA_RATIOS, and DIVIDENDDATA_QUOTE. These functions allow for dynamic, live data retrieval directly into spreadsheet cells, transforming static sheets into powerful, auto-updating analysis tools. The integration requires no coding, maintaining the familiar spreadsheet environment while supercharging its capabilities with professional data feeds.
Extensive Historical & Fundamental Data Library
Dividend Data grants instant access to a deep historical database covering 30+ years of market data. This includes not only dividend history and forward-looking metrics but also complete fundamental data: income statements, balance sheets, cash flow statements, and over 100 key financial ratios (e.g., P/E Ratio, Debt-to-Equity). The coverage of 80,000+ tickers ensures data is available for a vast array of global stocks, ETFs, and other securities, supporting thorough historical trend analysis and comparative fundamental research.
Dividend-First Analytical Functions
Tailored specifically for income investors, the tool offers specialized functions that output critical dividend metrics. Users can retrieve forward annual dividends, forward dividend yields, next ex-dividend dates, payout ratios, and dividend growth rates with single formulas. This focused feature set allows for rapid screening, yield calculation, and sustainability analysis directly within a portfolio model or research sheet, streamlining the workflow for constructing and monitoring dividend growth portfolios.
Free Tier with Generous Monthly Credits
A key differentiator is the sustainable free access model. The platform offers a permanent free tier that provides 2,500 credits per month without trial expiration or credit card requirements. This allows users to perform substantial monthly analysis, such as pulling data for hundreds of stock queries, at zero cost. This model lowers the barrier to entry for individual investors and provides real utility before any upgrade consideration.
Use Cases
Automated Dividend Portfolio Tracking
Investors can build a dynamic dividend portfolio tracker in their preferred spreadsheet. By using formulas like DIVIDENDDATA_DIVIDENDS to pull yield and payment data for each holding, the portfolio sheet can automatically calculate projected annual income, portfolio yield, and track ex-dividend dates. This eliminates manual data entry and ensures the portfolio dashboard always reflects the latest declared dividends and share prices.
Fundamental Stock Screening and Analysis
Analysts and investors can create custom stock screens using the live data functions. By building a sheet with columns for various metrics (e.g., P/E ratio, dividend yield, payout ratio, EPS growth), users can paste a list of tickers and instantly populate a comparable analysis matrix. This facilitates rapid identification of stocks meeting specific fundamental criteria, such as those with a yield above 3%, a P/E below 20, and a payout ratio under 60%.
Historical Financial Performance Research
For deep-dive research on a specific company, users can construct multi-year financial models. Formulas can pull 10+ years of annual revenue, net income, EPS, and dividend per share data into adjacent columns, enabling the creation of charts and the calculation of compound annual growth rates (CAGR) for critical financial metrics. This supports thorough due diligence on a company's long-term financial health and dividend growth trajectory.
Educational Modeling and Backtesting
Students and investing enthusiasts can use the historical price and dividend data to build educational models. For instance, they can create a sheet to backtest a dividend reinvestment plan (DRIP) strategy by pulling historical prices and dividend dates to simulate growth over time. This hands-on access to real historical data provides a practical tool for learning about equity analysis and portfolio mechanics.
Frequently Asked Questions
What data can I access with the free tier?
The free tier provides full access to all of Dividend Data's 16+ custom functions and the entire database of over 80,000 tickers and 30+ years of history. Your usage is limited by a monthly credit allowance of 2,500 credits. Each data point retrieved (e.g., one cell with a price, a dividend yield, an EPS figure) typically consumes one credit. This allows for hundreds to thousands of data points per month, suitable for substantial personal analysis and portfolio tracking.
How does the spreadsheet add-in get installed?
For Google Sheets, you install the "Dividend Data" add-on directly from the Google Workspace Marketplace. For Microsoft Excel, you install the "Dividend Data" add-in from the Microsoft AppSource store within Excel. Both processes are straightforward, following the standard installation flow for each platform. Once installed, the custom functions become available in your spreadsheet, and you can start using them immediately after a quick account sign-up.
Is the data provided live and real-time?
The data is live and reflects the most recent information available from Dividend Data's providers. For market quotes like stock price, it is typically real-time or delayed based on the data feed. Fundamental data, such as financial statements and dividends, is updated as soon as the information is publicly released and processed. The average response time for a data request is 0.84 seconds, ensuring your spreadsheets update quickly.
Do I need to know how to code or use APIs?
No coding or API knowledge is required. Dividend Data is designed specifically to be a no-code solution. All data integration is handled through simple, pre-built spreadsheet formulas that work identically to native functions like SUM() or VLOOKUP(). You only need to know the ticker symbol and the metric code (provided in the documentation) to retrieve any data point.
Similar to Dividend Data


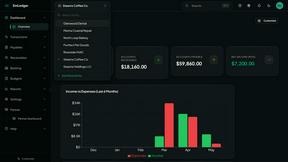
EmLedger
EmLedger offers unified multi-entity accounting with real double-entry systems for a flat fee, eliminating per-entity charges.

Notesnchat
NotesnChat is an all-in-one productivity app that combines task management, note-taking, reminders, and communication for seamless organization.