Dividend Data vs echoloc
Side-by-side comparison to help you choose the right tool.
Dividend Data
Dividend Data delivers automated stock data, including dividends and financials, directly into your Google Sheets or Excel spreadsheets.
Last updated: March 11, 2026
Echoloc uncovers buying signals in job posts, enabling sales teams to target accounts ready to purchase.
Last updated: February 28, 2026
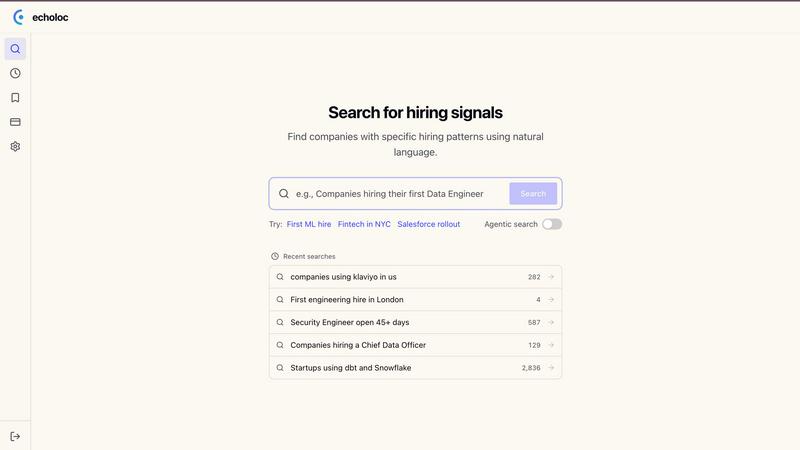
Visual Comparison
Dividend Data

echoloc
Feature Comparison
Dividend Data
Comprehensive Spreadsheet Integration
The platform provides seamless integration with both Google Sheets and Microsoft Excel via dedicated add-ins. Users access data through 16+ custom functions, such as DIVIDENDDATA_DIVIDENDS, DIVIDENDDATA_RATIOS, and DIVIDENDDATA_QUOTE. These functions allow for dynamic, live data retrieval directly into spreadsheet cells, transforming static sheets into powerful, auto-updating analysis tools. The integration requires no coding, maintaining the familiar spreadsheet environment while supercharging its capabilities with professional data feeds.
Extensive Historical & Fundamental Data Library
Dividend Data grants instant access to a deep historical database covering 30+ years of market data. This includes not only dividend history and forward-looking metrics but also complete fundamental data: income statements, balance sheets, cash flow statements, and over 100 key financial ratios (e.g., P/E Ratio, Debt-to-Equity). The coverage of 80,000+ tickers ensures data is available for a vast array of global stocks, ETFs, and other securities, supporting thorough historical trend analysis and comparative fundamental research.
Dividend-First Analytical Functions
Tailored specifically for income investors, the tool offers specialized functions that output critical dividend metrics. Users can retrieve forward annual dividends, forward dividend yields, next ex-dividend dates, payout ratios, and dividend growth rates with single formulas. This focused feature set allows for rapid screening, yield calculation, and sustainability analysis directly within a portfolio model or research sheet, streamlining the workflow for constructing and monitoring dividend growth portfolios.
Free Tier with Generous Monthly Credits
A key differentiator is the sustainable free access model. The platform offers a permanent free tier that provides 2,500 credits per month without trial expiration or credit card requirements. This allows users to perform substantial monthly analysis, such as pulling data for hundreds of stock queries, at zero cost. This model lowers the barrier to entry for individual investors and provides real utility before any upgrade consideration.
echoloc
Real-Time Job Posting Analysis
Echoloc provides real-time analysis of over 10 million job postings, tracking the hiring activities of more than 30 million companies globally. This feature ensures that sales professionals have access to the latest insights and trends, allowing them to respond quickly to emerging opportunities.
Evidence-Based Results
Every match in Echoloc comes with proof, including snippets from job postings that provide context and validate the buying signals. This eliminates ambiguity and fosters confidence in the outreach strategies employed by sales teams, ensuring that they are based on concrete evidence rather than assumptions.
Intuitive Search Functionality
Users can search for specific hiring signals using plain English queries. This intuitive interface allows sales professionals to easily find relevant companies based on their hiring activities, such as "companies hiring their first data engineer," making the tool accessible and user-friendly.
Comprehensive Signal Tracking
Echoloc captures various hiring signals, including first hires, hiring spikes, and urgent needs. It categorizes these signals, enabling users to prioritize outreach based on the urgency and relevance of each opportunity, thus optimizing their sales efforts.
Use Cases
Dividend Data
Automated Dividend Portfolio Tracking
Investors can build a dynamic dividend portfolio tracker in their preferred spreadsheet. By using formulas like DIVIDENDDATA_DIVIDENDS to pull yield and payment data for each holding, the portfolio sheet can automatically calculate projected annual income, portfolio yield, and track ex-dividend dates. This eliminates manual data entry and ensures the portfolio dashboard always reflects the latest declared dividends and share prices.
Fundamental Stock Screening and Analysis
Analysts and investors can create custom stock screens using the live data functions. By building a sheet with columns for various metrics (e.g., P/E ratio, dividend yield, payout ratio, EPS growth), users can paste a list of tickers and instantly populate a comparable analysis matrix. This facilitates rapid identification of stocks meeting specific fundamental criteria, such as those with a yield above 3%, a P/E below 20, and a payout ratio under 60%.
Historical Financial Performance Research
For deep-dive research on a specific company, users can construct multi-year financial models. Formulas can pull 10+ years of annual revenue, net income, EPS, and dividend per share data into adjacent columns, enabling the creation of charts and the calculation of compound annual growth rates (CAGR) for critical financial metrics. This supports thorough due diligence on a company's long-term financial health and dividend growth trajectory.
Educational Modeling and Backtesting
Students and investing enthusiasts can use the historical price and dividend data to build educational models. For instance, they can create a sheet to backtest a dividend reinvestment plan (DRIP) strategy by pulling historical prices and dividend dates to simulate growth over time. This hands-on access to real historical data provides a practical tool for learning about equity analysis and portfolio mechanics.
echoloc
Identifying Growth Opportunities
Sales teams can utilize Echoloc to identify companies in a growth phase by monitoring job postings for critical positions, such as first technical hires. This insight allows them to approach these companies at the right time when they are most likely to invest in new solutions.
Targeting Scaling Companies
Echoloc can help sales professionals target startups and companies experiencing rapid scaling. By analyzing hiring spikes, they can pinpoint organizations that are expanding their teams and likely require additional resources, making their outreach more relevant.
Enhancing Sales Strategy
With access to verified hiring signals, sales teams can refine their strategies and tailor their messaging. They can focus on companies that show clear intent to buy, such as those hiring for specific roles that correlate with their product offerings.
Staying Ahead of Competitors
Echoloc equips sales teams with an edge by providing insights that are not yet available on traditional intent data platforms. By acting on signals before they become mainstream, teams can engage potential buyers earlier, thereby increasing their chances of closing deals.
Overview
About Dividend Data
Dividend Data is a specialized financial data platform engineered to provide institutional-grade stock market intelligence directly within the workflow of fundamental and dividend investors. Its core product is a powerful spreadsheet add-in for Google Sheets and Microsoft Excel that eliminates the traditional barriers to accessing deep financial data. The platform delivers over 30 years of historical and real-time data for more than 80,000 global tickers through a suite of simple, custom spreadsheet formulas. Users can instantly pull critical metrics such as dividend amounts, yields, payout ratios, growth rates, complete financial statements, earnings data, valuation ratios, and price history without requiring API keys, coding knowledge, or manual copy-pasting from external sources. Built by a dividend investor for the community, Dividend Data distinguishes itself with a permanently free tier offering 2,500 monthly credits, robust functionality across both major spreadsheet ecosystems, and a focus on the specific data points that income-focused and value investors need to make informed decisions. It is designed for individual investors, financial analysts, and portfolio managers who demand comprehensive, reliable data but seek to avoid the complexity and high cost typically associated with professional financial data terminals.
About echoloc
Echoloc is a revolutionary platform tailored specifically for sales professionals seeking to enhance their lead generation strategies. By leveraging advanced machine learning algorithms, Echoloc analyzes millions of job postings to unveil critical buying signals that indicate when companies are gearing up to invest in new technologies or services. This groundbreaking approach empowers sales development representatives (SDRs), account executives (AEs), and revenue teams to identify potential opportunities well before they surface in conventional intent data sources. For example, when a company advertises for its first data engineer or significantly expands its sales team, it signals a growth phase indicative of increased spending. Echoloc transforms these job postings into actionable insights, allowing sales teams to engage prospects with informed, timely outreach. By tapping into this wealth of data, Echoloc not only enhances targeting precision but also positions teams ahead of competitors, enabling them to capture buyer intent before it becomes widely recognized.
Frequently Asked Questions
Dividend Data FAQ
What data can I access with the free tier?
The free tier provides full access to all of Dividend Data's 16+ custom functions and the entire database of over 80,000 tickers and 30+ years of history. Your usage is limited by a monthly credit allowance of 2,500 credits. Each data point retrieved (e.g., one cell with a price, a dividend yield, an EPS figure) typically consumes one credit. This allows for hundreds to thousands of data points per month, suitable for substantial personal analysis and portfolio tracking.
How does the spreadsheet add-in get installed?
For Google Sheets, you install the "Dividend Data" add-on directly from the Google Workspace Marketplace. For Microsoft Excel, you install the "Dividend Data" add-in from the Microsoft AppSource store within Excel. Both processes are straightforward, following the standard installation flow for each platform. Once installed, the custom functions become available in your spreadsheet, and you can start using them immediately after a quick account sign-up.
Is the data provided live and real-time?
The data is live and reflects the most recent information available from Dividend Data's providers. For market quotes like stock price, it is typically real-time or delayed based on the data feed. Fundamental data, such as financial statements and dividends, is updated as soon as the information is publicly released and processed. The average response time for a data request is 0.84 seconds, ensuring your spreadsheets update quickly.
Do I need to know how to code or use APIs?
No coding or API knowledge is required. Dividend Data is designed specifically to be a no-code solution. All data integration is handled through simple, pre-built spreadsheet formulas that work identically to native functions like SUM() or VLOOKUP(). You only need to know the ticker symbol and the metric code (provided in the documentation) to retrieve any data point.
echoloc FAQ
How does Echoloc track job postings?
Echoloc employs advanced machine learning algorithms to continuously analyze job postings across various platforms. This allows it to identify significant hiring signals that indicate potential buyer intent.
Can I customize my search queries in Echoloc?
Yes, Echoloc features an intuitive search functionality that allows users to input queries in plain English. This customization enables sales professionals to find the specific hiring signals they are interested in.
What types of companies can I track with Echoloc?
Echoloc tracks a wide range of companies across multiple industries, providing insights into over 30 million organizations. Users can focus on particular sectors, company sizes, or geographical locations based on their sales strategy.
Is there support available for new users?
Yes, Echoloc offers comprehensive support for new users, including tutorials, FAQs, and customer service, ensuring that all users can maximize the platform's capabilities effectively.
Alternatives
Dividend Data Alternatives
Dividend Data is a specialized financial data add-on for Google Sheets and Microsoft Excel, falling into the category of fundamental and dividend investment analysis tools. It provides direct spreadsheet integration for historical dividend data, financial statements, and key metrics without requiring programming skills or API management. Users may explore alternatives for various reasons, including specific budget constraints, the need for different data points like options or macroeconomic indicators, integration with other platforms such as trading software, or a preference for a standalone desktop application rather than a spreadsheet add-on. The core requirement often remains consistent: reliable, historical financial data to inform investment decisions. When evaluating an alternative, key considerations should include the depth and historical range of the dividend dataset, the total cost relative to your data consumption, the ease of integration with your existing workflow, and the breadth of supplementary fundamental metrics offered, such as financial ratios and earnings data.
echoloc Alternatives
Echoloc is an innovative platform that falls under the Business & Finance category, designed specifically for sales professionals. By analyzing job postings, Echoloc identifies buying signals that indicate when organizations are likely to invest in new technologies or services. This capability allows sales teams to engage with potential buyers at the right moment, enhancing their outreach strategies. Users often seek alternatives to Echoloc due to various reasons, including pricing structures, feature sets, and specific platform requirements. When exploring alternatives, it's crucial to evaluate aspects such as data accuracy, ease of integration with existing tools, and the ability to provide actionable insights. Understanding these factors can help users make an informed decision that best suits their sales objectives.