Fusedash vs StatPecker
Side-by-side comparison to help you choose the right tool.
Fusedash transforms raw data into intuitive dashboards and charts, empowering teams to act on insights in real time.
Last updated: March 4, 2026

StatPecker
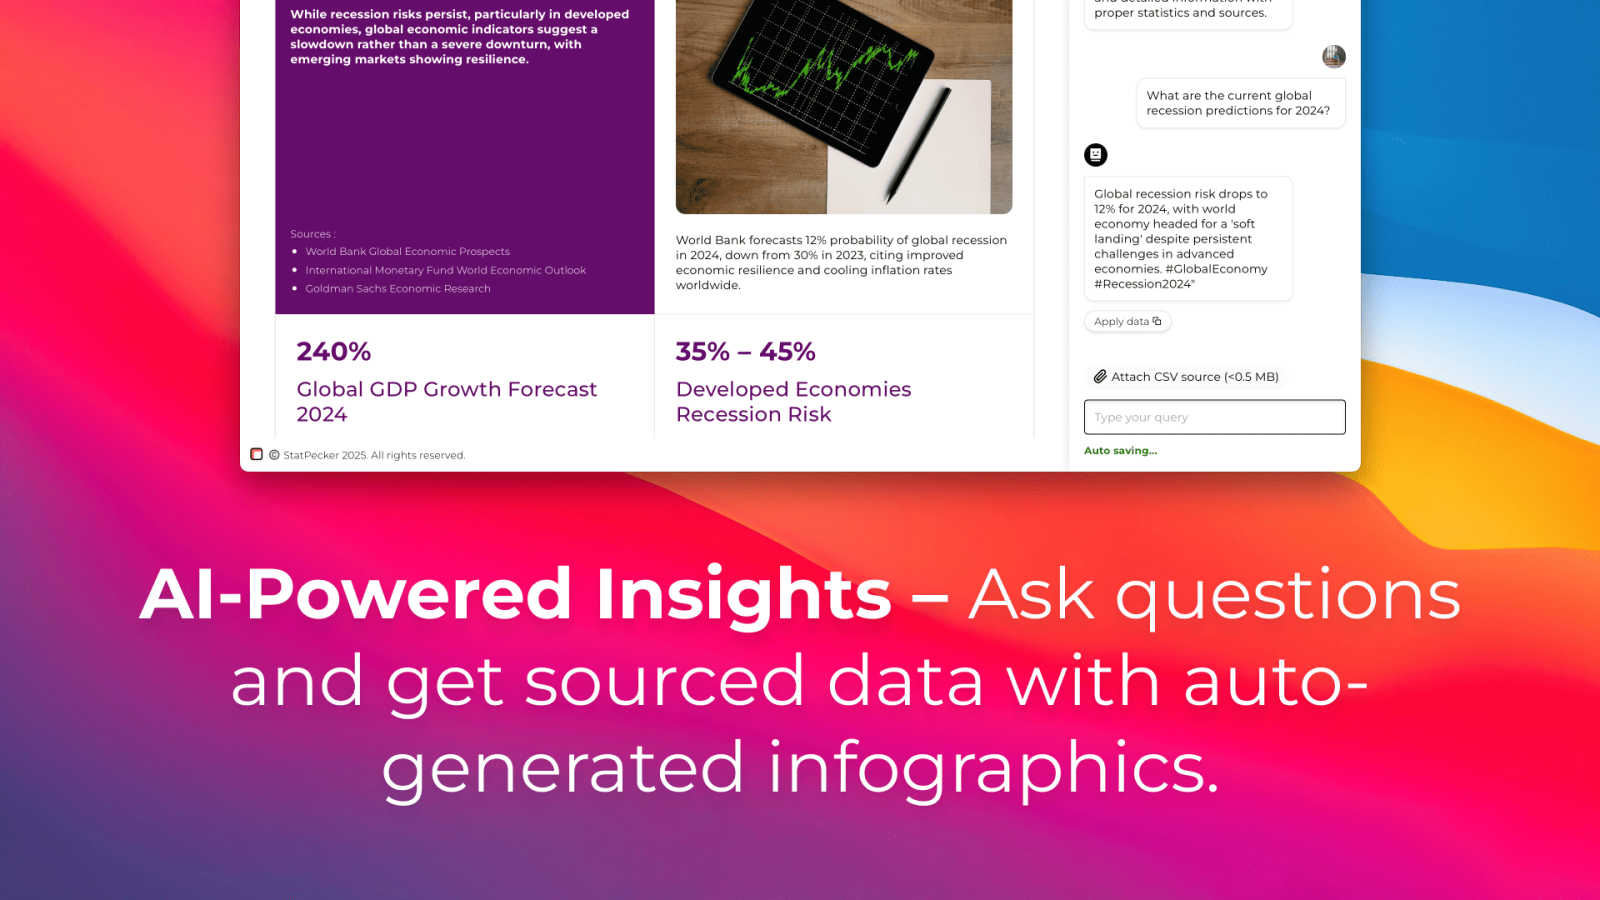
StatPecker uses AI to analyze data and create instant, shareable insights and infographics from your CSV files.
Last updated: March 1, 2026
Visual Comparison
Fusedash

StatPecker
Feature Comparison
Fusedash
Flexible Views
Fusedash allows users to create diverse visualizations tailored to different stakeholders. Whether it is dashboards, charts, maps, or report-style views, users can customize layouts, filters, and time ranges to ensure that each audience receives the specific insights they need, all without redundant efforts.
AI Chart Generator
The AI Chart Generator within Fusedash empowers users to create visual representations of their data from CSVs or APIs in mere minutes. This feature automatically selects the appropriate chart types, applies necessary comparisons, and refines labels to ensure accurate storytelling through visuals, enhancing the clarity and impact of reports.
Dashboard Software
Fusedash integrates dashboarding and reporting into a single workspace, allowing teams to monitor KPIs and provide contextual insights simultaneously. By combining performance metrics with narrative elements, users can clearly communicate changes, their implications, and future actions, minimizing discrepancies in reporting.
AI Chat
The AI Chat feature serves as an intelligent assistant, enabling users to inquire about their data using plain language. It provides suggestions for suitable metrics, charts, and breakdowns, facilitating a smoother workflow and helping teams quickly transform insights into shareable dashboard views.
StatPecker
Ask Your Query
StatPecker allows users to obtain instant insights by querying data in natural language. This feature eliminates the need for complex tools, enabling users to simply ask questions and receive validated answers quickly and efficiently.
Publish & Embed
With StatPecker, users can make their visuals interactive and easily integrate them into blogs, articles, and websites. This feature ensures that data storytelling is not only engaging but also accessible to a wider audience.
Upload & Analyze CSVs
Users can upload CSV files of up to 50 MB and conduct analyses without the hassle of traditional spreadsheet software. This feature allows for local analysis, ensuring that sensitive data remains private and secure while providing insightful visualizations.
Download & Use Anywhere
StatPecker facilitates the export of infographics as images, which can be utilized in reports, presentations, and more. This flexibility allows users to leverage their visual data storytelling across various formats and platforms.
Use Cases
Fusedash
Real-Time Monitoring
Fusedash is ideal for teams requiring real-time data insights. By connecting their datasets, users can create live dashboards that provide immediate visibility into performance metrics, allowing quick reactions to emerging trends and ensuring proactive decision-making.
Stakeholder Reporting
Organizations can leverage Fusedash to generate comprehensive reports for stakeholders that combine visual data and narrative context. This ensures that all parties have a unified understanding of performance, reducing the likelihood of miscommunication and aligning strategic objectives.
Data Exploration
Fusedash is perfect for teams that need to explore data dynamically. By utilizing the AI Chart Generator and Smart Chat, users can quickly generate relevant visualizations and insights tailored to specific inquiries, fostering a culture of data-driven exploration and informed decision-making.
Cross-Department Collaboration
Fusedash facilitates collaboration across various departments by enabling teams to share consistent views and definitions. This unified approach ensures that all teams—from finance to marketing—are aligned on key metrics and KPIs, helping to bridge gaps in understanding and enhance overall organizational efficiency.
StatPecker
Content Creation
Content creators can leverage StatPecker to transform complex data into visually appealing infographics that enhance their articles and blog posts. This capability allows for improved audience engagement and comprehension of data-driven narratives.
Market Research
Researchers and analysts can use StatPecker to quickly visualize market trends and comparisons. By uploading CSV files and asking targeted questions, they can extract insights that inform strategic decisions and business planning.
Educational Applications
Educators and students can utilize StatPecker to create compelling visual aids for presentations and assignments. The ability to produce professional-quality infographics quickly enhances the learning process and facilitates better communication of ideas.
Marketing Campaigns
Marketing professionals can employ StatPecker to generate visually engaging content for campaigns. By leveraging instant insights and interactive visuals, they can effectively communicate key messages and data to their target audiences.
Overview
About Fusedash
Fusedash is an advanced AI-powered data visualization platform engineered to enable teams to convert their interconnected data into clear and actionable insights. It serves as a comprehensive workspace where users can effortlessly create decision-ready dashboards, interactive charts, detailed maps, and narrative reports without the need to replicate the same logic across various disconnected tools. This platform's core value proposition centers on consistency and efficiency: users define key metrics and KPIs once, and these definitions can be reused across every view and report. This ensures that all members of the organization—from leadership and marketing to operations—are aligned with the same trusted numbers. Fusedash is tailored for teams overwhelmed by manual reporting cycles and contradictory data narratives. It empowers users to monitor real-time data effectively and to delve into the underlying reasons behind trends by segmenting data across regions or timeframes. With integrated AI features such as natural language data chat and smart visualization assistance, Fusedash streamlines data exploration and reporting, transforming raw data into a unified source of truth that fosters alignment and prompt action.
About StatPecker
StatPecker is an advanced AI-powered data visualization and storytelling platform designed to convert raw and unstructured data into visually appealing, publication-ready infographics in a matter of seconds. This innovative platform serves as an automated alternative to traditional report generation methods, significantly reducing both time and financial costs associated with data communication. StatPecker democratizes data visualization, making sophisticated graphical representations accessible to users without technical expertise in complex spreadsheet tools or graphic design software. The platform is tailored for a diverse range of users, including content creators, journalists, data analysts, researchers, marketing professionals, business strategists, educators, and students. By leveraging artificial intelligence, StatPecker empowers users to extract instant insights from both natural language queries and structured CSV data files. Users can simply upload datasets, ask questions in plain language, and receive accurate, visually engaging outputs that can be downloaded, published, or seamlessly embedded into digital content. This streamlining of the workflow from data analysis to visual presentation enhances the clarity and impact of data-driven narratives across various applications such as reports, articles, campaigns, and educational materials.
Frequently Asked Questions
Fusedash FAQ
What types of data sources can Fusedash connect to?
Fusedash can connect to a variety of data sources including CSV files, APIs, and public datasets, allowing users to aggregate and analyze information from multiple origins seamlessly.
How does Fusedash ensure metric consistency across reports?
Users can define key metrics and KPIs once within Fusedash, which are then reused throughout all dashboards and reports. This standardization guarantees that everyone in the organization is referencing the same data definitions, promoting trust in the insights generated.
Can Fusedash be used for real-time data monitoring?
Yes, Fusedash supports real-time data monitoring. By connecting to live data sources, users can create dashboards that update in real-time, providing instant visibility into performance metrics and trends.
Is it possible to customize visualizations in Fusedash?
Absolutely. Fusedash offers extensive customization options for visualizations, including layout adjustments, filter settings, and time range selections, ensuring that each dashboard or report can be tailored to meet specific audience needs.
StatPecker FAQ
How does StatPecker ensure data privacy?
StatPecker utilizes a local SQL agent for on-device analysis, meaning that data uploaded by users remains on their devices and is not shared with external servers. This approach prioritizes user privacy and data security.
Can I use StatPecker for free?
Yes, StatPecker offers a free tier that allows users to create unlimited projects and embeds, conduct a limited number of AI queries, and upload CSV files. This tier provides a cost-effective way to access essential features of the platform.
What types of files can I upload to StatPecker?
Users can upload structured CSV files of up to 50 MB for analysis. This functionality allows users to extract insights from their data without the complexity of traditional spreadsheet software.
Is there customer support available?
StatPecker provides customer support through various channels, ensuring that users can receive assistance with any inquiries or issues they may encounter while using the platform.
Alternatives
Fusedash Alternatives
Fusedash is an AI-powered data visualization platform that falls under the categories of Analytics & Data and Business Intelligence. It enables teams to turn raw data into actionable insights through clear dashboards and interactive charts. Users often seek alternatives to Fusedash for various reasons, including pricing concerns, specific feature requirements, or compatibility with existing platforms. When evaluating alternatives, it is essential to consider factors such as ease of use, the ability to customize dashboards, integration capabilities, and the level of support offered by the provider. --- [{"question": "What is Fusedash?", "answer": "Fusedash is an AI-powered data visualization platform designed to transform raw data into clear, actionable insights through dashboards and interactive charts."}, {"question": "Who is Fusedash for?", "answer": "Fusedash is built for teams across various departments, including leadership, marketing, and operations, who seek to streamline reporting and ensure everyone is aligned on key metrics."}, {"question": "Is Fusedash free?", "answer": "Fusedash does not offer a free version; pricing details can be obtained from their official website."}, {"question": "What are the main features of Fusedash?", "answer": "Key features of Fusedash include decision-ready dashboards, real-time interfaces, natural language data chat, smart visualization assistance, and the ability to define key metrics for consistent reporting."}]
StatPecker Alternatives
StatPecker is an advanced AI-powered data visualization and storytelling platform that transforms raw, unstructured data into publication-ready infographics in just seconds. It is designed to serve a diverse range of users, from content creators to business strategists, by automating the process of report generation that traditionally involves manual efforts and technical expertise. Users often seek alternatives to StatPecker for various reasons, including pricing, specific feature sets, or compatibility with their existing platforms. When selecting an alternative, it is crucial to consider the user interface, ease of data integration, the quality of visualizations produced, and the level of customer support offered. Additionally, features like natural language querying and automated analysis can significantly enhance the user experience, making the choice of an alternative even more critical.