Dividend Data vs GrowPanel
Side-by-side comparison to help you choose the right tool.
Dividend Data
Dividend Data delivers automated stock data, including dividends and financials, directly into your Google Sheets or Excel spreadsheets.
Last updated: March 11, 2026
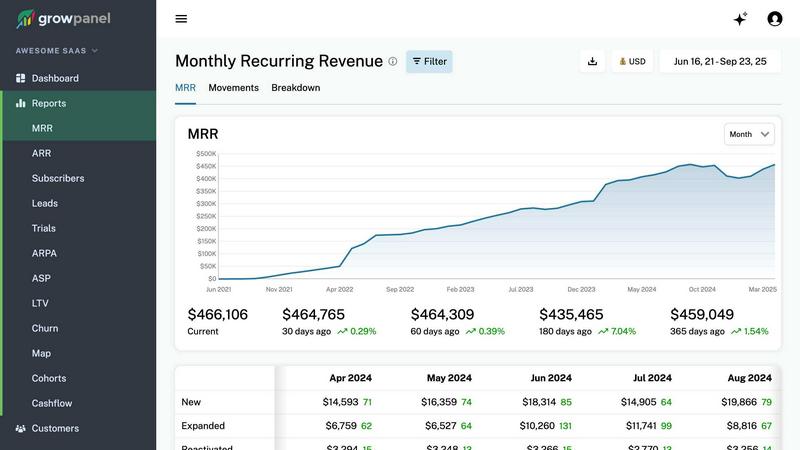
GrowPanel
GrowPanel delivers real-time MRR, churn, and LTV analytics for SaaS, connecting seamlessly with major billing platforms.
Last updated: February 26, 2026
Visual Comparison
Dividend Data

GrowPanel
Feature Comparison
Dividend Data
Comprehensive Spreadsheet Integration
The platform provides seamless integration with both Google Sheets and Microsoft Excel via dedicated add-ins. Users access data through 16+ custom functions, such as DIVIDENDDATA_DIVIDENDS, DIVIDENDDATA_RATIOS, and DIVIDENDDATA_QUOTE. These functions allow for dynamic, live data retrieval directly into spreadsheet cells, transforming static sheets into powerful, auto-updating analysis tools. The integration requires no coding, maintaining the familiar spreadsheet environment while supercharging its capabilities with professional data feeds.
Extensive Historical & Fundamental Data Library
Dividend Data grants instant access to a deep historical database covering 30+ years of market data. This includes not only dividend history and forward-looking metrics but also complete fundamental data: income statements, balance sheets, cash flow statements, and over 100 key financial ratios (e.g., P/E Ratio, Debt-to-Equity). The coverage of 80,000+ tickers ensures data is available for a vast array of global stocks, ETFs, and other securities, supporting thorough historical trend analysis and comparative fundamental research.
Dividend-First Analytical Functions
Tailored specifically for income investors, the tool offers specialized functions that output critical dividend metrics. Users can retrieve forward annual dividends, forward dividend yields, next ex-dividend dates, payout ratios, and dividend growth rates with single formulas. This focused feature set allows for rapid screening, yield calculation, and sustainability analysis directly within a portfolio model or research sheet, streamlining the workflow for constructing and monitoring dividend growth portfolios.
Free Tier with Generous Monthly Credits
A key differentiator is the sustainable free access model. The platform offers a permanent free tier that provides 2,500 credits per month without trial expiration or credit card requirements. This allows users to perform substantial monthly analysis, such as pulling data for hundreds of stock queries, at zero cost. This model lowers the barrier to entry for individual investors and provides real utility before any upgrade consideration.
GrowPanel
Real-time MRR, ARR, churn, and LTV tracking
GrowPanel provides instantaneous tracking of crucial revenue metrics like Monthly Recurring Revenue (MRR), Annual Recurring Revenue (ARR), churn rates, and Lifetime Value (LTV). This feature allows businesses to monitor their financial health continuously, enabling proactive adjustments to improve retention and growth.
Trial conversion and cohort analysis
The platform offers in-depth insights into trial user behavior by analyzing conversion patterns and cohort performance. Businesses can utilize this feature to identify successful strategies for converting trial users into paying customers, ultimately optimizing their sales funnel.
Revenue segmentation by plan, country, currency, or custom attributes
With GrowPanel, users can segment their revenue data by various parameters including subscription plan, geographical location, currency, or any custom-defined attributes. This granular approach aids in understanding market dynamics and tailoring marketing strategies to different customer segments.
Cashflow reporting including fees, refunds, taxes, and FX
GrowPanel's cashflow reporting functionality offers a comprehensive view of revenue streams, including one-time payments, refunds, fees, and taxes. This feature ensures that businesses have a clear understanding of their cash position, allowing for better financial planning and risk management.
Use Cases
Dividend Data
Automated Dividend Portfolio Tracking
Investors can build a dynamic dividend portfolio tracker in their preferred spreadsheet. By using formulas like DIVIDENDDATA_DIVIDENDS to pull yield and payment data for each holding, the portfolio sheet can automatically calculate projected annual income, portfolio yield, and track ex-dividend dates. This eliminates manual data entry and ensures the portfolio dashboard always reflects the latest declared dividends and share prices.
Fundamental Stock Screening and Analysis
Analysts and investors can create custom stock screens using the live data functions. By building a sheet with columns for various metrics (e.g., P/E ratio, dividend yield, payout ratio, EPS growth), users can paste a list of tickers and instantly populate a comparable analysis matrix. This facilitates rapid identification of stocks meeting specific fundamental criteria, such as those with a yield above 3%, a P/E below 20, and a payout ratio under 60%.
Historical Financial Performance Research
For deep-dive research on a specific company, users can construct multi-year financial models. Formulas can pull 10+ years of annual revenue, net income, EPS, and dividend per share data into adjacent columns, enabling the creation of charts and the calculation of compound annual growth rates (CAGR) for critical financial metrics. This supports thorough due diligence on a company's long-term financial health and dividend growth trajectory.
Educational Modeling and Backtesting
Students and investing enthusiasts can use the historical price and dividend data to build educational models. For instance, they can create a sheet to backtest a dividend reinvestment plan (DRIP) strategy by pulling historical prices and dividend dates to simulate growth over time. This hands-on access to real historical data provides a practical tool for learning about equity analysis and portfolio mechanics.
GrowPanel
Optimizing subscription growth strategies
SaaS companies can leverage GrowPanel to analyze their subscription growth strategies by monitoring MRR and churn rates. By gaining insights into customer behavior, businesses can make data-driven decisions to enhance their offerings and improve conversion rates.
Enhancing customer retention efforts
Using cohort analysis, businesses can identify trends in customer retention and understand the reasons behind churn. This enables them to implement targeted retention strategies, ensuring that they maintain a loyal customer base while reducing turnover.
Streamlining financial reporting
Finance teams can utilize GrowPanel to streamline their financial reporting processes. With real-time cashflow insights and segmented revenue data, teams can prepare accurate reports quickly, minimizing the administrative burden associated with traditional financial analysis.
Facilitating mobile management
For executives and managers on the go, GrowPanel’s mobile-friendly dashboards provide the ability to access vital metrics anytime, anywhere. This ensures that decision-makers remain informed and can act swiftly, regardless of their location.
Overview
About Dividend Data
Dividend Data is a specialized financial data platform engineered to provide institutional-grade stock market intelligence directly within the workflow of fundamental and dividend investors. Its core product is a powerful spreadsheet add-in for Google Sheets and Microsoft Excel that eliminates the traditional barriers to accessing deep financial data. The platform delivers over 30 years of historical and real-time data for more than 80,000 global tickers through a suite of simple, custom spreadsheet formulas. Users can instantly pull critical metrics such as dividend amounts, yields, payout ratios, growth rates, complete financial statements, earnings data, valuation ratios, and price history without requiring API keys, coding knowledge, or manual copy-pasting from external sources. Built by a dividend investor for the community, Dividend Data distinguishes itself with a permanently free tier offering 2,500 monthly credits, robust functionality across both major spreadsheet ecosystems, and a focus on the specific data points that income-focused and value investors need to make informed decisions. It is designed for individual investors, financial analysts, and portfolio managers who demand comprehensive, reliable data but seek to avoid the complexity and high cost typically associated with professional financial data terminals.
About GrowPanel
GrowPanel is an advanced subscription analytics platform designed specifically for Software as a Service (SaaS) companies that seek to gain clear visibility into their revenue metrics without the complexities of traditional spreadsheet management. By integrating seamlessly with popular billing platforms such as Stripe, Chargebee, and Recurly, GrowPanel allows users to establish a robust analytics framework within minutes. The platform provides real-time dashboards that display essential metrics including Monthly Recurring Revenue (MRR), Annual Recurring Revenue (ARR), churn rates, retention statistics, expansion revenue, and cohort analysis. This real-time data empowers businesses to make informed decisions swiftly, enhancing their overall operational efficiency. With a user-friendly interface and mobile-friendly dashboards, GrowPanel is tailored to meet the needs of high-growth SaaS businesses, enabling them to track their financial performance with clarity and confidence. The platform is free until users reach an ARR of $200k, ensuring accessibility for startups and small businesses.
Frequently Asked Questions
Dividend Data FAQ
What data can I access with the free tier?
The free tier provides full access to all of Dividend Data's 16+ custom functions and the entire database of over 80,000 tickers and 30+ years of history. Your usage is limited by a monthly credit allowance of 2,500 credits. Each data point retrieved (e.g., one cell with a price, a dividend yield, an EPS figure) typically consumes one credit. This allows for hundreds to thousands of data points per month, suitable for substantial personal analysis and portfolio tracking.
How does the spreadsheet add-in get installed?
For Google Sheets, you install the "Dividend Data" add-on directly from the Google Workspace Marketplace. For Microsoft Excel, you install the "Dividend Data" add-in from the Microsoft AppSource store within Excel. Both processes are straightforward, following the standard installation flow for each platform. Once installed, the custom functions become available in your spreadsheet, and you can start using them immediately after a quick account sign-up.
Is the data provided live and real-time?
The data is live and reflects the most recent information available from Dividend Data's providers. For market quotes like stock price, it is typically real-time or delayed based on the data feed. Fundamental data, such as financial statements and dividends, is updated as soon as the information is publicly released and processed. The average response time for a data request is 0.84 seconds, ensuring your spreadsheets update quickly.
Do I need to know how to code or use APIs?
No coding or API knowledge is required. Dividend Data is designed specifically to be a no-code solution. All data integration is handled through simple, pre-built spreadsheet formulas that work identically to native functions like SUM() or VLOOKUP(). You only need to know the ticker symbol and the metric code (provided in the documentation) to retrieve any data point.
GrowPanel FAQ
How does GrowPanel integrate with my existing billing platform?
GrowPanel enables seamless integration with various billing platforms including Stripe, Chargebee, and Recurly. Users can connect their billing source with just one click, allowing for instantaneous data flow and real-time analytics.
Is GrowPanel compliant with GDPR regulations?
Yes, GrowPanel is EU-hosted and fully compliant with GDPR regulations, ensuring that user data is handled securely and responsibly. This compliance is crucial for businesses operating in or serving customers in the European Union.
What types of reports can I generate using GrowPanel?
GrowPanel allows users to generate a variety of reports, including cashflow reports, cohort analysis, and revenue segmentation reports. Users can customize their reports to focus on specific metrics that matter most to their business.
Can I access GrowPanel on my mobile device?
Absolutely. GrowPanel is designed to be mobile-friendly, allowing users to access all features and reports on their smartphones or tablets. This ensures that users can monitor their subscription metrics and make decisions on the go without any compromise in functionality.
Alternatives
Dividend Data Alternatives
Dividend Data is a specialized financial data add-on for Google Sheets and Microsoft Excel, falling into the category of fundamental and dividend investment analysis tools. It provides direct spreadsheet integration for historical dividend data, financial statements, and key metrics without requiring programming skills or API management. Users may explore alternatives for various reasons, including specific budget constraints, the need for different data points like options or macroeconomic indicators, integration with other platforms such as trading software, or a preference for a standalone desktop application rather than a spreadsheet add-on. The core requirement often remains consistent: reliable, historical financial data to inform investment decisions. When evaluating an alternative, key considerations should include the depth and historical range of the dividend dataset, the total cost relative to your data consumption, the ease of integration with your existing workflow, and the breadth of supplementary fundamental metrics offered, such as financial ratios and earnings data.
GrowPanel Alternatives
GrowPanel is a sophisticated subscription analytics platform designed specifically for SaaS companies seeking clarity in their revenue metrics. By enabling users to connect their billing platforms such as Stripe, Chargebee, or Recurly with just one click, GrowPanel presents real-time dashboards that encompass critical metrics like MRR, ARR, churn, and LTV. This alleviates the common burden of managing complex spreadsheets, allowing businesses to focus on growth and strategy. Users often seek alternatives to GrowPanel for various reasons, including pricing structures, feature sets, or specific platform compatibility needs. When searching for an alternative, it is important to consider factors such as the comprehensiveness of analytics offered, ease of integration with existing systems, and the level of support provided. A thorough assessment of these criteria can help businesses find a solution that aligns with their operational requirements and growth goals.