Dividend Data vs Redbark
Side-by-side comparison to help you choose the right tool.
Dividend Data
Dividend Data delivers automated stock data, including dividends and financials, directly into your Google Sheets or Excel spreadsheets.
Last updated: March 11, 2026
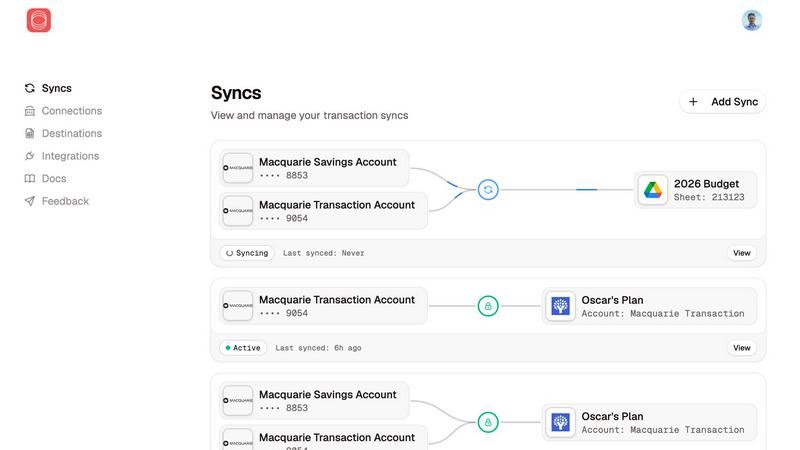
Redbark automates syncing your Australian bank and brokerage data to Google Sheets, YNAB, and more with real-time.
Last updated: March 4, 2026
Visual Comparison
Dividend Data

Redbark
Feature Comparison
Dividend Data
Comprehensive Spreadsheet Integration
The platform provides seamless integration with both Google Sheets and Microsoft Excel via dedicated add-ins. Users access data through 16+ custom functions, such as DIVIDENDDATA_DIVIDENDS, DIVIDENDDATA_RATIOS, and DIVIDENDDATA_QUOTE. These functions allow for dynamic, live data retrieval directly into spreadsheet cells, transforming static sheets into powerful, auto-updating analysis tools. The integration requires no coding, maintaining the familiar spreadsheet environment while supercharging its capabilities with professional data feeds.
Extensive Historical & Fundamental Data Library
Dividend Data grants instant access to a deep historical database covering 30+ years of market data. This includes not only dividend history and forward-looking metrics but also complete fundamental data: income statements, balance sheets, cash flow statements, and over 100 key financial ratios (e.g., P/E Ratio, Debt-to-Equity). The coverage of 80,000+ tickers ensures data is available for a vast array of global stocks, ETFs, and other securities, supporting thorough historical trend analysis and comparative fundamental research.
Dividend-First Analytical Functions
Tailored specifically for income investors, the tool offers specialized functions that output critical dividend metrics. Users can retrieve forward annual dividends, forward dividend yields, next ex-dividend dates, payout ratios, and dividend growth rates with single formulas. This focused feature set allows for rapid screening, yield calculation, and sustainability analysis directly within a portfolio model or research sheet, streamlining the workflow for constructing and monitoring dividend growth portfolios.
Free Tier with Generous Monthly Credits
A key differentiator is the sustainable free access model. The platform offers a permanent free tier that provides 2,500 credits per month without trial expiration or credit card requirements. This allows users to perform substantial monthly analysis, such as pulling data for hundreds of stock queries, at zero cost. This model lowers the barrier to entry for individual investors and provides real utility before any upgrade consideration.
Redbark
Seamless Integration
Redbark provides an effortless integration experience by allowing users to connect their Australian bank accounts and sync transactions directly to popular tools like Google Sheets, Notion, and YNAB. This feature removes the need for manual data exports, ensuring real-time updates and complete privacy.
Multi-Destination Support
Users can sync the same financial accounts to multiple destinations simultaneously, such as Google Sheets and YNAB, with each destination maintaining its own formatting. This flexibility is crucial for users managing different aspects of their finances across various platforms.
Pass-Through Data Architecture
Redbark employs a pass-through data architecture where financial data flows directly from the user's bank to their designated tools. This ensures that no transaction details, balances, or account information are stored on Redbark's servers, enhancing security and privacy.
Smart Deduplication
The smart deduplication feature intelligently handles potential duplicate transactions through an ID-based system with overlap buffers. This ensures that users do not face issues with duplicate entries, providing a cleaner and more accurate financial overview.
Use Cases
Dividend Data
Automated Dividend Portfolio Tracking
Investors can build a dynamic dividend portfolio tracker in their preferred spreadsheet. By using formulas like DIVIDENDDATA_DIVIDENDS to pull yield and payment data for each holding, the portfolio sheet can automatically calculate projected annual income, portfolio yield, and track ex-dividend dates. This eliminates manual data entry and ensures the portfolio dashboard always reflects the latest declared dividends and share prices.
Fundamental Stock Screening and Analysis
Analysts and investors can create custom stock screens using the live data functions. By building a sheet with columns for various metrics (e.g., P/E ratio, dividend yield, payout ratio, EPS growth), users can paste a list of tickers and instantly populate a comparable analysis matrix. This facilitates rapid identification of stocks meeting specific fundamental criteria, such as those with a yield above 3%, a P/E below 20, and a payout ratio under 60%.
Historical Financial Performance Research
For deep-dive research on a specific company, users can construct multi-year financial models. Formulas can pull 10+ years of annual revenue, net income, EPS, and dividend per share data into adjacent columns, enabling the creation of charts and the calculation of compound annual growth rates (CAGR) for critical financial metrics. This supports thorough due diligence on a company's long-term financial health and dividend growth trajectory.
Educational Modeling and Backtesting
Students and investing enthusiasts can use the historical price and dividend data to build educational models. For instance, they can create a sheet to backtest a dividend reinvestment plan (DRIP) strategy by pulling historical prices and dividend dates to simulate growth over time. This hands-on access to real historical data provides a practical tool for learning about equity analysis and portfolio mechanics.
Redbark
Freelancers Managing Invoices
Freelancers can benefit greatly from Redbark by automatically syncing transaction data related to invoices directly into Google Sheets or Notion. This eliminates the tedious task of manual entry, allowing them to focus on their work rather than on bookkeeping.
Investors Tracking Portfolios
Investors can monitor their portfolios effortlessly by syncing data from various brokerages into a single dashboard. Redbark automates the data flow, providing real-time updates on investment holdings and performance without the hassle of manual updates.
Small Business Owners Managing Cash Flow
Small business owners can utilize Redbark to keep track of their cash flow by automatically syncing their bank transactions to budgeting tools like YNAB. This helps them maintain an accurate overview of their finances, ensuring informed decision-making.
Individuals Seeking Financial Clarity
Anyone looking for a clearer view of their financial situation can use Redbark to consolidate data from multiple accounts into a single location. The automated syncing provides a comprehensive overview of their financial health without the risk of data loss or error from manual entry.
Overview
About Dividend Data
Dividend Data is a specialized financial data platform engineered to provide institutional-grade stock market intelligence directly within the workflow of fundamental and dividend investors. Its core product is a powerful spreadsheet add-in for Google Sheets and Microsoft Excel that eliminates the traditional barriers to accessing deep financial data. The platform delivers over 30 years of historical and real-time data for more than 80,000 global tickers through a suite of simple, custom spreadsheet formulas. Users can instantly pull critical metrics such as dividend amounts, yields, payout ratios, growth rates, complete financial statements, earnings data, valuation ratios, and price history without requiring API keys, coding knowledge, or manual copy-pasting from external sources. Built by a dividend investor for the community, Dividend Data distinguishes itself with a permanently free tier offering 2,500 monthly credits, robust functionality across both major spreadsheet ecosystems, and a focus on the specific data points that income-focused and value investors need to make informed decisions. It is designed for individual investors, financial analysts, and portfolio managers who demand comprehensive, reliable data but seek to avoid the complexity and high cost typically associated with professional financial data terminals.
About Redbark
Redbark is a revolutionary tool designed to streamline the management of your financial data by securely connecting your Australian bank accounts and global investment portfolios to the productivity tools you already use, such as Google Sheets, Notion, and Airtable. With Redbark, the cumbersome and error-prone tasks of manual data entry and messy CSV imports are eliminated, providing users with a seamless experience. Utilizing Australia’s Consumer Data Right (CDR) framework, Redbark ensures bank-approved access to your transaction, balance, and investment holding data, which syncs automatically based on a schedule you control. This architecture guarantees that no sensitive information is ever stored on Redbark's servers, prioritizing privacy and security. Ideal for freelancers tracking invoices, investors monitoring portfolios, and small business owners managing cash flow, Redbark offers an intuitive solution for anyone seeking an automated view of their finances in familiar formats. Set up takes just minutes, with no coding skills required, and supports numerous Australian banks, New Zealand banks via Akahu, and global brokerages through SnapTrade.
Frequently Asked Questions
Dividend Data FAQ
What data can I access with the free tier?
The free tier provides full access to all of Dividend Data's 16+ custom functions and the entire database of over 80,000 tickers and 30+ years of history. Your usage is limited by a monthly credit allowance of 2,500 credits. Each data point retrieved (e.g., one cell with a price, a dividend yield, an EPS figure) typically consumes one credit. This allows for hundreds to thousands of data points per month, suitable for substantial personal analysis and portfolio tracking.
How does the spreadsheet add-in get installed?
For Google Sheets, you install the "Dividend Data" add-on directly from the Google Workspace Marketplace. For Microsoft Excel, you install the "Dividend Data" add-in from the Microsoft AppSource store within Excel. Both processes are straightforward, following the standard installation flow for each platform. Once installed, the custom functions become available in your spreadsheet, and you can start using them immediately after a quick account sign-up.
Is the data provided live and real-time?
The data is live and reflects the most recent information available from Dividend Data's providers. For market quotes like stock price, it is typically real-time or delayed based on the data feed. Fundamental data, such as financial statements and dividends, is updated as soon as the information is publicly released and processed. The average response time for a data request is 0.84 seconds, ensuring your spreadsheets update quickly.
Do I need to know how to code or use APIs?
No coding or API knowledge is required. Dividend Data is designed specifically to be a no-code solution. All data integration is handled through simple, pre-built spreadsheet formulas that work identically to native functions like SUM() or VLOOKUP(). You only need to know the ticker symbol and the metric code (provided in the documentation) to retrieve any data point.
Redbark FAQ
How does Redbark ensure the security of my financial data?
Redbark utilizes a pass-through architecture where your financial data flows directly from your bank to your chosen tools. It never stores your transactions or account details, and all sensitive data is encrypted at rest using AES-256 encryption.
What Australian banks and brokerages does Redbark support?
Redbark supports connections to over 100 Australian banks via the CDR framework and includes global brokerages and crypto exchanges through SnapTrade. This extensive support allows users to manage a wide range of financial accounts.
Is Redbark compliant with Australian regulations?
Yes, Redbark operates under the Consumer Data Right framework and is connected through an ACCC-accredited data recipient, ensuring compliance with Australian regulations and providing users with safe and secure access to their financial data.
How long does it take to set up Redbark?
Setting up Redbark is quick and straightforward, taking just minutes to connect your bank accounts and configure your preferred destinations. The user-friendly interface requires no coding skills, making it accessible for everyone.
Alternatives
Dividend Data Alternatives
Dividend Data is a specialized financial data add-on for Google Sheets and Microsoft Excel, falling into the category of fundamental and dividend investment analysis tools. It provides direct spreadsheet integration for historical dividend data, financial statements, and key metrics without requiring programming skills or API management. Users may explore alternatives for various reasons, including specific budget constraints, the need for different data points like options or macroeconomic indicators, integration with other platforms such as trading software, or a preference for a standalone desktop application rather than a spreadsheet add-on. The core requirement often remains consistent: reliable, historical financial data to inform investment decisions. When evaluating an alternative, key considerations should include the depth and historical range of the dividend dataset, the total cost relative to your data consumption, the ease of integration with your existing workflow, and the breadth of supplementary fundamental metrics offered, such as financial ratios and earnings data.
Redbark Alternatives
Redbark is an innovative financial data synchronization tool designed specifically for Australian users. It falls under the categories of business and personal finance, allowing users to seamlessly connect their bank accounts and brokerage data to popular productivity applications like Google Sheets and YNAB. This automated solution eliminates the hassles of manual data entry and outdated screen-scraping methods, ensuring secure access to financial information through Australia's Consumer Data Right (CDR) framework. Users often seek alternatives to Redbark due to various factors such as pricing, specific feature sets, or compatibility with different platforms. When considering alternatives, it's crucial to evaluate the ease of use, security measures, and the range of supported financial institutions. Additionally, users should assess whether the alternative can meet their unique financial tracking needs without compromising on automation and data integrity.