Skippership vs StatPecker
Side-by-side comparison to help you choose the right tool.
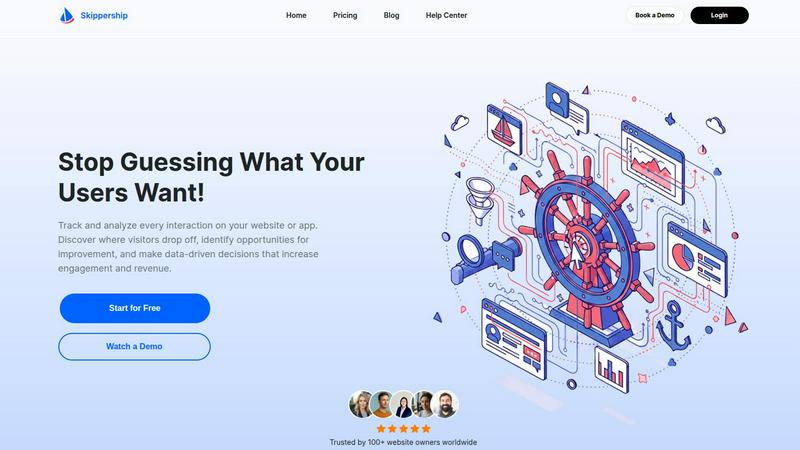
Skippership
Skippership leverages AI to analyze user behavior, pinpoint friction, and enhance engagement for better conversion.
Last updated: March 1, 2026

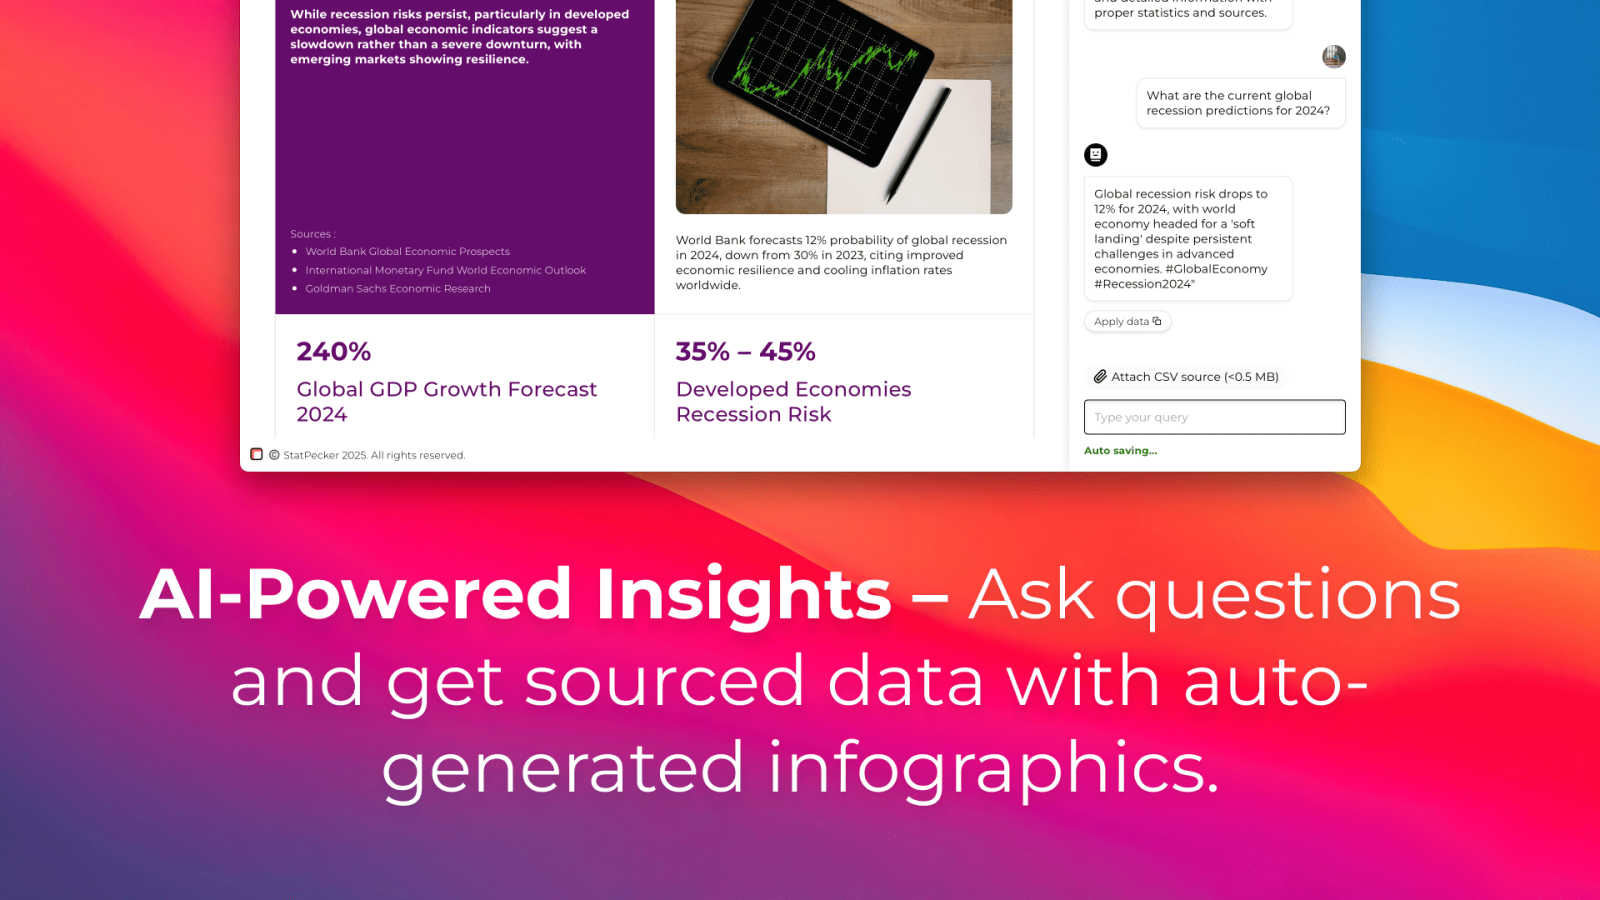
StatPecker
StatPecker uses AI to analyze data and create instant, shareable insights and infographics from your CSV files.
Last updated: March 1, 2026
Visual Comparison
Skippership
StatPecker
Feature Comparison
Skippership
Session Replays
Session replays allow users to watch real-time recordings of actual user interactions on their site. By observing user journeys, teams can identify friction points and usability issues, enabling them to take informed, data-driven actions that enhance the overall user experience.
Interactive Heatmaps
Skippership's interactive heatmaps provide valuable insights into user engagement by illustrating where users click, scroll, and spend time on pages. This visual representation highlights overlooked areas of content, guiding teams to optimize their strategies for boosting user engagement and conversion rates.
Goal Tracking
With goal tracking, Skippership enables users to monitor key actions such as signups, purchases, and clicks seamlessly. This feature helps teams measure performance, identify patterns in user behavior, and gain real-time insights into the factors driving conversions.
AI Analytics
The AI analytics feature leverages machine learning to uncover behavioral patterns and insights within user data. By automating the identification of trends and anomalies, this feature empowers teams to make quicker, data-driven decisions that enhance user engagement, retention, and overall business outcomes.
StatPecker
Ask Your Query
StatPecker allows users to obtain instant insights by querying data in natural language. This feature eliminates the need for complex tools, enabling users to simply ask questions and receive validated answers quickly and efficiently.
Publish & Embed
With StatPecker, users can make their visuals interactive and easily integrate them into blogs, articles, and websites. This feature ensures that data storytelling is not only engaging but also accessible to a wider audience.
Upload & Analyze CSVs
Users can upload CSV files of up to 50 MB and conduct analyses without the hassle of traditional spreadsheet software. This feature allows for local analysis, ensuring that sensitive data remains private and secure while providing insightful visualizations.
Download & Use Anywhere
StatPecker facilitates the export of infographics as images, which can be utilized in reports, presentations, and more. This flexibility allows users to leverage their visual data storytelling across various formats and platforms.
Use Cases
Skippership
Identifying User Friction
Skippership can help businesses pinpoint specific areas where users encounter friction during their journey. By analyzing session recordings and heatmaps, product teams can swiftly identify and address usability issues that may hinder conversions.
Optimizing Landing Pages
Marketers can utilize Skippership to evaluate the effectiveness of landing pages. By assessing user interactions and behaviors, they can make informed adjustments to content and design, ultimately boosting conversion rates and improving user experience.
Enhancing User Retention
With insights from goal tracking and AI analytics, businesses can identify actions that correlate with user retention. This allows teams to refine their strategies to foster long-lasting relationships with users, increasing overall customer loyalty.
Streamlining Product Development
Developers can leverage Skippership to gain insights into user behavior, allowing them to prioritize features and enhancements that directly address user needs. This data-driven approach to product development ensures that resources are allocated effectively to maximize user satisfaction.
StatPecker
Content Creation
Content creators can leverage StatPecker to transform complex data into visually appealing infographics that enhance their articles and blog posts. This capability allows for improved audience engagement and comprehension of data-driven narratives.
Market Research
Researchers and analysts can use StatPecker to quickly visualize market trends and comparisons. By uploading CSV files and asking targeted questions, they can extract insights that inform strategic decisions and business planning.
Educational Applications
Educators and students can utilize StatPecker to create compelling visual aids for presentations and assignments. The ability to produce professional-quality infographics quickly enhances the learning process and facilitates better communication of ideas.
Marketing Campaigns
Marketing professionals can employ StatPecker to generate visually engaging content for campaigns. By leveraging instant insights and interactive visuals, they can effectively communicate key messages and data to their target audiences.
Overview
About Skippership
Skippership is a state-of-the-art, AI-powered product analytics platform designed to deliver in-depth insights into user behavior on websites and applications. It caters to a diverse audience, including product managers, UX designers, marketers, and developers, who seek to go beyond superficial metrics and grasp the underlying causes of user friction, drop-offs, and conversion failures. By integrating session recordings, interactive heatmaps, goal and funnel tracking, and comprehensive journey analysis into a single, user-friendly dashboard, Skippership simplifies complex data interpretation. The platform's advanced AI engine actively analyzes session data, automatically pinpointing areas of user struggle and highlighting critical issues. Furthermore, it provides actionable recommendations in real-time, transforming raw behavioral data into prioritized insights. This enables teams to make informed, data-driven decisions that enhance user experience, boost engagement, and increase conversion rates. With its no-code setup, minimal performance impact, and adherence to robust security standards, Skippership makes sophisticated user behavior analysis accessible for teams of all sizes.
About StatPecker
StatPecker is an advanced AI-powered data visualization and storytelling platform designed to convert raw and unstructured data into visually appealing, publication-ready infographics in a matter of seconds. This innovative platform serves as an automated alternative to traditional report generation methods, significantly reducing both time and financial costs associated with data communication. StatPecker democratizes data visualization, making sophisticated graphical representations accessible to users without technical expertise in complex spreadsheet tools or graphic design software. The platform is tailored for a diverse range of users, including content creators, journalists, data analysts, researchers, marketing professionals, business strategists, educators, and students. By leveraging artificial intelligence, StatPecker empowers users to extract instant insights from both natural language queries and structured CSV data files. Users can simply upload datasets, ask questions in plain language, and receive accurate, visually engaging outputs that can be downloaded, published, or seamlessly embedded into digital content. This streamlining of the workflow from data analysis to visual presentation enhances the clarity and impact of data-driven narratives across various applications such as reports, articles, campaigns, and educational materials.
Frequently Asked Questions
Skippership FAQ
What type of data does Skippership collect?
Skippership collects anonymized user interaction data, including clicks, scrolls, session duration, and navigation paths. This data is used to analyze user behavior and identify areas for improvement without compromising user privacy.
How does Skippership ensure data security?
Skippership employs SSL/TLS encryption to secure data during transmission and utilizes secure cloud storage solutions. The platform adheres to GDPR and CCPA standards, ensuring that all data is processed and stored in compliance with privacy regulations.
Can Skippership integrate with other tools?
Yes, Skippership offers seamless integration with over 50 platforms, including Google Analytics, WordPress, Shopify, and more. This helps unify your tech stack and streamlines workflows for a more efficient analysis process.
Is there a free trial available?
Skippership offers a free trial option, allowing users to explore the platform's features and capabilities before committing to a subscription. This enables teams to assess how Skippership can meet their specific analytics needs.
StatPecker FAQ
How does StatPecker ensure data privacy?
StatPecker utilizes a local SQL agent for on-device analysis, meaning that data uploaded by users remains on their devices and is not shared with external servers. This approach prioritizes user privacy and data security.
Can I use StatPecker for free?
Yes, StatPecker offers a free tier that allows users to create unlimited projects and embeds, conduct a limited number of AI queries, and upload CSV files. This tier provides a cost-effective way to access essential features of the platform.
What types of files can I upload to StatPecker?
Users can upload structured CSV files of up to 50 MB for analysis. This functionality allows users to extract insights from their data without the complexity of traditional spreadsheet software.
Is there customer support available?
StatPecker provides customer support through various channels, ensuring that users can receive assistance with any inquiries or issues they may encounter while using the platform.
Alternatives
Skippership Alternatives
Skippership is an innovative AI-powered product analytics platform that falls under the category of analytics and data solutions. It provides deep insights into user behavior on websites and applications, enabling teams to identify and resolve user friction points effectively. Users often seek alternatives to Skippership for various reasons, such as pricing considerations, the need for specific features, or compatibility with different platforms. When evaluating alternatives, it is essential to look for capabilities that suit your team's requirements, ease of integration, and the ability to provide actionable insights that drive user experience improvements.
StatPecker Alternatives
StatPecker is an advanced AI-powered data visualization and storytelling platform that transforms raw, unstructured data into publication-ready infographics in just seconds. It is designed to serve a diverse range of users, from content creators to business strategists, by automating the process of report generation that traditionally involves manual efforts and technical expertise. Users often seek alternatives to StatPecker for various reasons, including pricing, specific feature sets, or compatibility with their existing platforms. When selecting an alternative, it is crucial to consider the user interface, ease of data integration, the quality of visualizations produced, and the level of customer support offered. Additionally, features like natural language querying and automated analysis can significantly enhance the user experience, making the choice of an alternative even more critical.