
PollQR
PollQR creates dynamic QR code surveys and live polls to enhance customer feedback and audience engagement seamlessly.
About PollQR
PollQR is a sophisticated software platform specifically designed to enhance audience interaction through the innovative use of QR codes. It addresses two primary forms of engagement: long-term feedback collection and real-time polling. The platform caters to two distinct user groups: business professionals, including owners, managers, and marketers, who utilize PollQR as a comprehensive QR code survey generator, and presenters, trainers, educators, and event organizers who leverage its robust live polling capabilities. For businesses, PollQR enables the creation of mobile-optimized feedback forms that capture customer insights, facilitate positive online reviews, and gather lead information over time. Meanwhile, for presenters, it transforms passive audiences into active participants during events, with no app required for engagement. The unique value proposition of PollQR lies in its dual functionality, offering powerful tools for both asynchronous surveys and synchronous live interactions, all supported by AI-driven analytics that convert raw data into actionable insights. The platform features professional form builders, a secure database for responses, real-time visualizations for live polls, and automated notifications, making it an all-encompassing solution for audience engagement.
Features
QR Code Survey Generator
The QR Code Survey Generator allows users to effortlessly create mobile-friendly surveys that can be scanned by customers in various locations, such as stores or restaurants. This feature is essential for gathering consumer feedback, driving positive reviews, and collecting leads over time. The intuitive interface ensures that businesses can set up surveys quickly and efficiently, maximizing response rates and customer engagement.
Live Polling System
The Live Polling System enables presenters to create interactive polls that can be displayed during live events. Attendees can participate in real-time without needing to download any applications, making the process seamless and engaging. This feature supports various poll types, including rankings and word clouds, allowing presenters to gauge audience sentiment and adapt their presentations accordingly.
AI-Powered Analytics
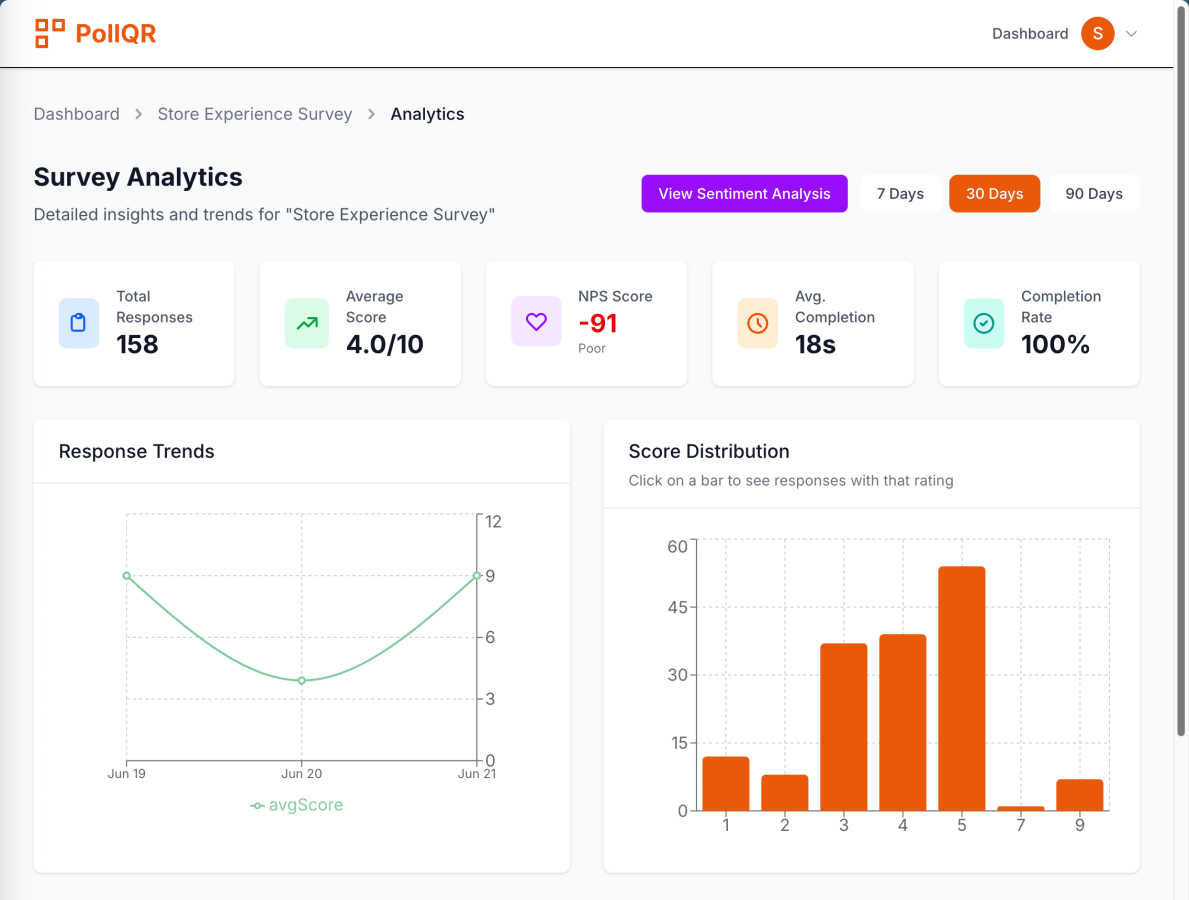
PollQR's AI-Powered Analytics tools provide users with deep insights into customer feedback and engagement. The analytics engine processes survey data and polling results to identify trends, sentiment, and key themes. This functionality helps businesses understand customer preferences and areas needing improvement, empowering them to make data-driven decisions that enhance their services and products.
Automated Notification System
The Automated Notification System keeps users informed about incoming survey responses and poll results. Users can receive real-time email notifications when feedback is submitted, allowing for timely engagement with customers. This feature ensures that businesses can act quickly on insights gathered from their audience, enhancing overall responsiveness and customer satisfaction.
Use Cases
Customer Feedback Collection
Businesses can utilize PollQR to gather continuous feedback from customers, which is vital for improving products and services. By placing QR codes in strategic locations, such as on receipts or tables, companies can encourage customers to share their thoughts easily, thus enhancing their online reputation and driving more five-star reviews.
Audience Engagement in Presentations
Presenters can enhance audience engagement during meetings or lectures by utilizing PollQR’s live polling feature. By displaying QR codes on slides, attendees can participate in polls instantly. This approach not only makes presentations more interactive but also allows presenters to gauge audience opinions in real-time, thereby making the sessions more impactful.
Lead Generation for Marketing Campaigns
With PollQR, businesses can effectively collect leads through feedback forms embedded in QR codes. This capability allows marketers to gather valuable contact information from interested customers, which can then be used for follow-up marketing efforts or to build customer databases for future campaigns.
Training and Educational Sessions
Educators and trainers can apply PollQR in classrooms or workshops to create an interactive learning environment. By integrating live polls into their sessions, they can assess understanding and gather input from students, making the learning experience more dynamic and responsive to participant needs.
Frequently Asked Questions
What types of surveys can I create with PollQR?
PollQR allows users to create various types of surveys, including customer feedback forms, lead generation forms, and reviews solicitation. Each survey is customizable and mobile-optimized for ease of use.
Is there a limit to the number of QR codes I can generate?
PollQR offers flexible plans that cater to different user needs. Pro subscribers can create up to 100 polls per month, while additional a-la-carte options are available for those needing extra polls.
Can I analyze the data collected from my surveys?
Yes, PollQR includes robust AI-powered analytics tools that help users analyze survey data. You can gain insights into customer sentiment, identify key themes, and receive actionable recommendations based on the collected data.
Do participants need to download an app to engage with live polls?
No, participants do not need to download any application to engage with live polls created using PollQR. They can simply scan the QR code displayed during the presentation to participate.
Similar to PollQR

Foco ADHD Planner
FOCO helps ADHD minds beat task paralysis by breaking overwhelming tasks into clear, manageable steps so you can start, focus, and finish.
Going Rate
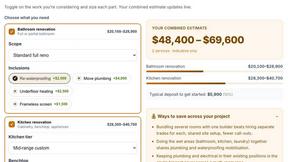
Going Rate gives you instant, free cost estimates for home renovations, health treatments, and more across Australia.
KalTalk
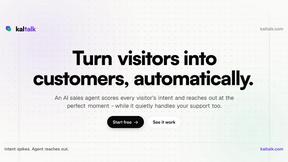
KalTalk deploys a single AI agent that resolves support tickets from your documentation and autonomously closes sales by scoring visitor intent.
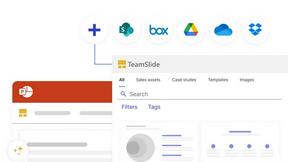
TeamSlide
TeamSlide lets your team build on-brand presentations instantly by syncing approved slides from your content system directly into PowerPoint.

EchoLeads AI
EchoLeads AI is an enterprise-grade platform using autonomous AI voice agents to automate cold calling, lead qualification, and omnichannel.
readywhen
readywhen automatically captures your decisions and commitments from tools you already use, then drafts your next steps so you just approve.