Dividend Data vs Portfolio Genius
Side-by-side comparison to help you choose the right tool.
Dividend Data
Dividend Data delivers automated stock data, including dividends and financials, directly into your Google Sheets or Excel spreadsheets.
Last updated: March 11, 2026
Portfolio Genius
Portfolio Genius is an AI-powered tool that automatically analyzes markets and executes trades for optimal portfolio.
Last updated: March 1, 2026
Visual Comparison
Dividend Data

Portfolio Genius
Feature Comparison
Dividend Data
Comprehensive Spreadsheet Integration
The platform provides seamless integration with both Google Sheets and Microsoft Excel via dedicated add-ins. Users access data through 16+ custom functions, such as DIVIDENDDATA_DIVIDENDS, DIVIDENDDATA_RATIOS, and DIVIDENDDATA_QUOTE. These functions allow for dynamic, live data retrieval directly into spreadsheet cells, transforming static sheets into powerful, auto-updating analysis tools. The integration requires no coding, maintaining the familiar spreadsheet environment while supercharging its capabilities with professional data feeds.
Extensive Historical & Fundamental Data Library
Dividend Data grants instant access to a deep historical database covering 30+ years of market data. This includes not only dividend history and forward-looking metrics but also complete fundamental data: income statements, balance sheets, cash flow statements, and over 100 key financial ratios (e.g., P/E Ratio, Debt-to-Equity). The coverage of 80,000+ tickers ensures data is available for a vast array of global stocks, ETFs, and other securities, supporting thorough historical trend analysis and comparative fundamental research.
Dividend-First Analytical Functions
Tailored specifically for income investors, the tool offers specialized functions that output critical dividend metrics. Users can retrieve forward annual dividends, forward dividend yields, next ex-dividend dates, payout ratios, and dividend growth rates with single formulas. This focused feature set allows for rapid screening, yield calculation, and sustainability analysis directly within a portfolio model or research sheet, streamlining the workflow for constructing and monitoring dividend growth portfolios.
Free Tier with Generous Monthly Credits
A key differentiator is the sustainable free access model. The platform offers a permanent free tier that provides 2,500 credits per month without trial expiration or credit card requirements. This allows users to perform substantial monthly analysis, such as pulling data for hundreds of stock queries, at zero cost. This model lowers the barrier to entry for individual investors and provides real utility before any upgrade consideration.
Portfolio Genius
Multi-Model AI Analysis Engine
Portfolio Genius integrates multiple state-of-the-art AI models, including GPT, Claude, and Gemini, to provide diverse analytical perspectives. Users can select or compare models based on their specific investment philosophy and risk tolerance. This architecture ensures that trade suggestions and portfolio insights are generated through a robust, multi-faceted analysis of market data, fundamentals, and sentiment, rather than relying on a single algorithmic viewpoint.
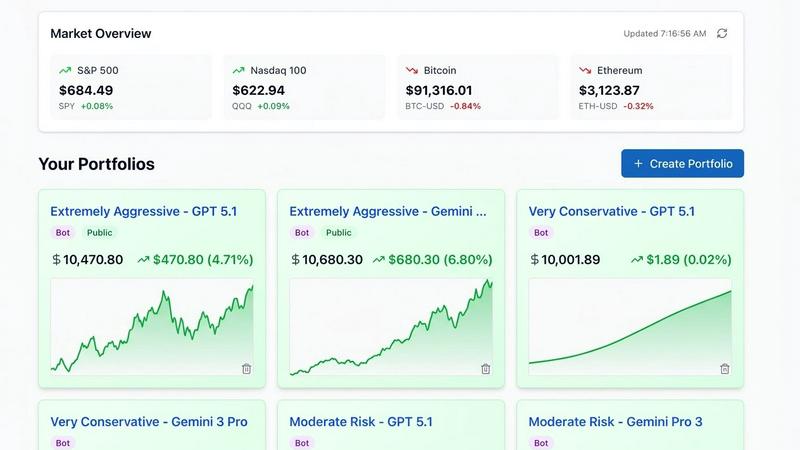
Real-Time Analytics & Unified Dashboard
The platform aggregates live market data, performance metrics, and news sentiment across all user holdings into a single, comprehensive dashboard. It tracks stocks, ETFs, and cryptocurrencies from major global exchanges, providing real-time updates on portfolio valuation, asset allocation, and sector diversification. This centralized view eliminates the need to monitor multiple platforms, delivering bank-grade encrypted data for complete portfolio oversight.
Automated Trade Suggestions & Execution
The AI engine continuously processes real-time prices, financial fundamentals, and news sentiment to generate data-driven trade suggestions. These recommendations include transparent reasoning for each proposed action. For Premium users, the platform offers integration with Alpaca brokerage for fully automated trade execution, enabling hands-free portfolio management based on predefined AI strategies and risk parameters.
Portfolio Leaderboards & Comparative Analysis
Portfolio Genius hosts public leaderboards where AI-managed portfolios compete in real-time across categories like Aggressive, Moderate, and Conservative. This feature allows users to compare the performance of different AI strategies, gain insights into successful tactical approaches, and benchmark their own portfolio's performance against a community of peers using the same analytical tools.
Use Cases
Dividend Data
Automated Dividend Portfolio Tracking
Investors can build a dynamic dividend portfolio tracker in their preferred spreadsheet. By using formulas like DIVIDENDDATA_DIVIDENDS to pull yield and payment data for each holding, the portfolio sheet can automatically calculate projected annual income, portfolio yield, and track ex-dividend dates. This eliminates manual data entry and ensures the portfolio dashboard always reflects the latest declared dividends and share prices.
Fundamental Stock Screening and Analysis
Analysts and investors can create custom stock screens using the live data functions. By building a sheet with columns for various metrics (e.g., P/E ratio, dividend yield, payout ratio, EPS growth), users can paste a list of tickers and instantly populate a comparable analysis matrix. This facilitates rapid identification of stocks meeting specific fundamental criteria, such as those with a yield above 3%, a P/E below 20, and a payout ratio under 60%.
Historical Financial Performance Research
For deep-dive research on a specific company, users can construct multi-year financial models. Formulas can pull 10+ years of annual revenue, net income, EPS, and dividend per share data into adjacent columns, enabling the creation of charts and the calculation of compound annual growth rates (CAGR) for critical financial metrics. This supports thorough due diligence on a company's long-term financial health and dividend growth trajectory.
Educational Modeling and Backtesting
Students and investing enthusiasts can use the historical price and dividend data to build educational models. For instance, they can create a sheet to backtest a dividend reinvestment plan (DRIP) strategy by pulling historical prices and dividend dates to simulate growth over time. This hands-on access to real historical data provides a practical tool for learning about equity analysis and portfolio mechanics.
Portfolio Genius
Augmenting Experienced Trader Strategies
Experienced traders and quantitative analysts utilize Portfolio Genius to augment their existing strategies with multi-model AI analysis. The platform serves as a secondary, data-intensive analyst that processes news sentiment and global market movements 24/7, providing alternative viewpoints and risk assessments that can validate or challenge the user's own theses, leading to more informed decision-making.
Hands-Off Portfolio Management for Professionals
Busy professionals with limited time for active portfolio management leverage the automated tracking and trade execution capabilities. By connecting their brokerage account and defining a risk profile, users can delegate routine monitoring and rebalancing to the AI, ensuring their portfolio is continuously optimized according to market conditions without requiring daily manual intervention.
Educational Tool for Investment Beginners
New investors use the platform as an educational sandbox to understand market dynamics and portfolio construction. The ability to create hypothetical portfolios without signing up, combined with the AI's transparent reasoning for each suggestion, helps beginners learn about asset allocation, risk management, and the impact of market news on different securities in a risk-free environment.
Portfolio Diversification and Risk Auditing
Investors concerned with over-concentration or unintended risk use the platform's advanced analytics to audit their holdings. The visual diversification breakdown and continuous fundamental analysis highlight exposure to specific sectors, geographies, or asset classes, providing data-driven alerts and suggestions to rebalance towards a healthier, target portfolio allocation.
Overview
About Dividend Data
Dividend Data is a specialized financial data platform engineered to provide institutional-grade stock market intelligence directly within the workflow of fundamental and dividend investors. Its core product is a powerful spreadsheet add-in for Google Sheets and Microsoft Excel that eliminates the traditional barriers to accessing deep financial data. The platform delivers over 30 years of historical and real-time data for more than 80,000 global tickers through a suite of simple, custom spreadsheet formulas. Users can instantly pull critical metrics such as dividend amounts, yields, payout ratios, growth rates, complete financial statements, earnings data, valuation ratios, and price history without requiring API keys, coding knowledge, or manual copy-pasting from external sources. Built by a dividend investor for the community, Dividend Data distinguishes itself with a permanently free tier offering 2,500 monthly credits, robust functionality across both major spreadsheet ecosystems, and a focus on the specific data points that income-focused and value investors need to make informed decisions. It is designed for individual investors, financial analysts, and portfolio managers who demand comprehensive, reliable data but seek to avoid the complexity and high cost typically associated with professional financial data terminals.
About Portfolio Genius
Portfolio Genius is a sophisticated, AI-powered portfolio management and analytics platform engineered to transform individual investment strategy through data-driven automation and intelligent insight generation. It functions as a comprehensive stock portfolio tracker augmented by advanced artificial intelligence that continuously analyzes global markets, real-time news sentiment, company fundamentals, and your specific holdings. The core value proposition lies in its ability to synthesize vast, disparate data streams into actionable trade suggestions with transparent reasoning, effectively serving as a 24/7 AI investment analyst. The platform is architected for a broad spectrum of users, from beginners seeking guided education to busy professionals requiring time-efficient portfolio oversight and experienced traders looking to augment their strategies with multi-model AI analysis. It supports manual trade execution based on AI recommendations or fully automated trading via brokerage integrations, all within a unified dashboard for monitoring multiple portfolios and performance metrics. By offering a choice of underlying AI models (GPT, Claude, Gemini), Portfolio Genius provides unprecedented flexibility, allowing users to align the analytical engine with their specific risk tolerance and investment philosophy.
Frequently Asked Questions
Dividend Data FAQ
What data can I access with the free tier?
The free tier provides full access to all of Dividend Data's 16+ custom functions and the entire database of over 80,000 tickers and 30+ years of history. Your usage is limited by a monthly credit allowance of 2,500 credits. Each data point retrieved (e.g., one cell with a price, a dividend yield, an EPS figure) typically consumes one credit. This allows for hundreds to thousands of data points per month, suitable for substantial personal analysis and portfolio tracking.
How does the spreadsheet add-in get installed?
For Google Sheets, you install the "Dividend Data" add-on directly from the Google Workspace Marketplace. For Microsoft Excel, you install the "Dividend Data" add-in from the Microsoft AppSource store within Excel. Both processes are straightforward, following the standard installation flow for each platform. Once installed, the custom functions become available in your spreadsheet, and you can start using them immediately after a quick account sign-up.
Is the data provided live and real-time?
The data is live and reflects the most recent information available from Dividend Data's providers. For market quotes like stock price, it is typically real-time or delayed based on the data feed. Fundamental data, such as financial statements and dividends, is updated as soon as the information is publicly released and processed. The average response time for a data request is 0.84 seconds, ensuring your spreadsheets update quickly.
Do I need to know how to code or use APIs?
No coding or API knowledge is required. Dividend Data is designed specifically to be a no-code solution. All data integration is handled through simple, pre-built spreadsheet formulas that work identically to native functions like SUM() or VLOOKUP(). You only need to know the ticker symbol and the metric code (provided in the documentation) to retrieve any data point.
Portfolio Genius FAQ
Does Portfolio Genius provide investment advice?
No. Portfolio Genius is a portfolio tracking and analytics platform that provides educational and informational analysis on securities and portfolio composition. The AI-generated trade suggestions and insights are for informational purposes only and should not be construed as personalized investment advice, an endorsement, or a recommendation to buy, sell, or hold any security. Users must make their own investment decisions.
What data sources does the AI analyze?
The AI analysis engine integrates and processes data from four primary sources in real-time: 1) Pricing services for live stock and ETF prices, 2) Financial fundamentals databases for company earnings and key metrics, 3) AI-powered news processing for sentiment analysis and market-moving event detection, and 4) Web search capabilities to incorporate the latest research and analyst reports into its contextual understanding.
How does the automated trading integration work?
For users on the Premium plan, Portfolio Genius offers integration with Alpaca brokerage. Users can connect their Alpaca account, granting the platform permission to execute trades automatically based on the AI's generated suggestions. Users typically configure parameters such as maximum position size, risk tolerance, and which types of suggestions to act upon, maintaining oversight while the platform handles order execution.
Is my financial data secure on the platform?
Yes. Portfolio Genius employs bank-grade, enterprise-level security standards to protect user data. All sensitive information and data transmissions are encrypted. The platform uses secure, read-only connections for brokerage integrations where applicable, and adheres to strict data privacy protocols to ensure that your portfolio information and personal data remain confidential and protected.
Alternatives
Dividend Data Alternatives
Dividend Data is a specialized financial data add-on for Google Sheets and Microsoft Excel, falling into the category of fundamental and dividend investment analysis tools. It provides direct spreadsheet integration for historical dividend data, financial statements, and key metrics without requiring programming skills or API management. Users may explore alternatives for various reasons, including specific budget constraints, the need for different data points like options or macroeconomic indicators, integration with other platforms such as trading software, or a preference for a standalone desktop application rather than a spreadsheet add-on. The core requirement often remains consistent: reliable, historical financial data to inform investment decisions. When evaluating an alternative, key considerations should include the depth and historical range of the dividend dataset, the total cost relative to your data consumption, the ease of integration with your existing workflow, and the breadth of supplementary fundamental metrics offered, such as financial ratios and earnings data.
Portfolio Genius Alternatives
Portfolio Genius is a sophisticated AI-powered portfolio management and analytics platform within the automated trading and investment advisor category. It leverages multiple large language models to analyze markets, generate actionable trade suggestions, and execute trades automatically or manually via brokerage integrations. Users may seek alternatives for various reasons, including specific budget constraints, a need for different brokerage compatibility, a preference for alternative analytical methodologies beyond multi-model AI, or requirements for more specialized asset class coverage. The search often centers on finding a platform that aligns with precise operational needs and investment philosophy. When evaluating alternatives, key considerations should include the underlying analytical engine's methodology, the degree of automation versus manual oversight offered, the breadth of supported asset classes and brokerages, the transparency of the reasoning behind recommendations, and the overall security and data privacy architecture. The ideal platform balances sophisticated insight generation with user-specific control parameters.