VolRadar
VolRadar scans 500+ S&P 500 stocks overnight to rank daily options premium-selling setups by volatility edge, automating morning research to 30.
tool Details
Explore More
Alternatives
About VolRadar
VolRadar is a daily options analytics platform purpose-built for premium sellers — traders who execute iron condors, credit spreads, cash-secured puts, and the wheel strategy on S&P 500 names. The platform eliminates the manual research burden by processing institutional-grade end-of-day options data from ORATS, CBOE, and S&P 500 indices through proprietary models. Every night after US market close, VolRadar pulls end-of-day data, runs it through its computational models, and delivers a pre-market brief by approximately 6 PM ET. By the time traders sit down with their morning coffee, they already know which tickers are worth selling premium on and which to skip entirely. The platform scans over 500 US stocks and major ETFs daily, providing computed strikes, volatility risk premium analysis, IV rank on a 252-day lookback, and earnings crush projections per ticker. VolRadar distills complex volatility data into a single Weather Score from 0 to 100, composited from Premium Edge, VIX, Vol Trend, Earnings Safety, and Term Structure factors. This score answers the fundamental question: is today a good day to sell premium? The platform offers a free tier with the Weather Score, four calculators, and a basic scanner, with paid tiers starting at $19 per month unlocking the full scanner, pre-market brief, computed strikes, and weekly trade ideas.
Features
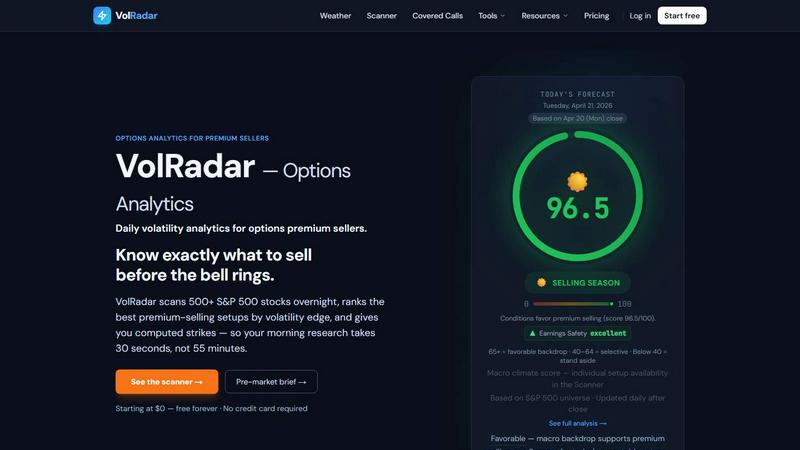
Weather Score
The Weather Score is a composite metric ranging from 0 to 100 that quantifies whether market conditions favor selling options premium. It aggregates five distinct factors: Premium Edge measures the relative overpricing of options; VIX captures overall market fear levels; Vol Trend identifies directional volatility shifts; Earnings Safety flags upcoming earnings events that could disrupt positions; and Term Structure evaluates the slope of the volatility curve. A score of 65 or higher indicates favorable conditions for broad premium selling, scores between 40 and 64 suggest selective trading with caution, and scores below 40 recommend standing aside entirely. The Weather Score updates daily after market close based on the S&P 500 universe and provides a 60-day historical chart for trend analysis.
IV Rank and VRP Analysis
VolRadar computes Implied Volatility Rank using a 252-day lookback on 30-day at-the-money implied volatility, giving traders a clear picture of where current IV stands relative to its historical range. The platform simultaneously calculates Volatility Risk Premium (VRP) as the difference between 30-day implied volatility and 20-day realized volatility. Positive VRP indicates options are overpriced relative to actual stock movement, creating favorable conditions for premium sellers. The platform surfaces stocks with positive VRP values across its 500+ ticker universe, with real-time counts showing how many names currently exhibit this characteristic. As of April 24, 2026, VolRadar identified 479 stocks with positive VRP and 351 stocks with elevated IV rank.
Computed Strikes and Strategy Builder
The Strategy Builder feature provides pre-filled strike prices with target deltas or target credits for each ticker, eliminating the need for manual strike selection. For each candidate, VolRadar ranks up to three optimal strategies, displaying estimated credit received, breakeven points, and maximum loss parameters. The platform supports seven strategy types including short puts, iron condors, credit spreads, covered calls, and the wheel strategy. Traders can specify their target delta or desired credit amount, and VolRadar computes the exact strikes to enter. This feature transforms the process from "which stock?" to "here's the trade" in approximately 30 seconds, with all risk parameters pre-calculated and displayed.
Earnings Crush and Risk Gates
VolRadar provides per-ticker earnings crush projections that quantify the expected IV collapse following earnings announcements. The platform flags stocks with upcoming earnings events using an earnings safety indicator that assesses the risk of holding premium through earnings. The Earnings Safety factor is color-coded: excellent, good, fair, or poor, with the Weather Score weighting this factor appropriately. Stocks with imminent earnings receive a special flag in the scanner, warning traders to either avoid those positions or adjust their strategy accordingly. This feature is critical for premium sellers who typically want to avoid earnings events that can cause unpredictable IV expansion and gap moves.
Use Cases
Morning Pre-Market Briefing
Premium sellers can review the daily pre-market brief delivered by 6 PM ET the previous evening, containing the Weather Score, top candidate tickers sorted by volatility edge, and key market statistics. The brief highlights changes from the previous day, such as the number of strong signal stocks (12 as of April 24, 2026), positive VRP stocks (479), and high IV stocks (351). Traders can assess overall market conditions, identify which sectors are showing elevated volatility, and select their top 3 to 5 candidates for the day's trading. This reduces morning research time from 55 minutes to approximately 30 seconds, allowing traders to focus on execution rather than data gathering.
Weekly Trade Planning
Using the full scanner unlocked in the Starter plan, traders can identify the best premium-selling setups for the upcoming week. The platform ranks all 500+ tickers by volatility edge, displaying IV Rank, RV Ratio, VRP, and signal strength for each. Traders can filter by strategy type, minimum credit, and maximum risk tolerance to build a diversified portfolio of premium-selling positions across different sectors and expiration dates. The weekly ideas feature provides curated selections of high-confidence setups, allowing traders to plan their trades in advance and monitor them throughout the week.
Covered Call and Wheel Strategy Execution
VolRadar includes a dedicated Covered Call screener that helps traders identify stocks with elevated IV where selling calls generates attractive premium relative to downside risk. The platform computes optimal strike prices for covered calls based on target delta or desired credit, with full P&L estimates for different scenarios. For wheel strategy practitioners, VolRadar provides both cash-secured put and covered call analysis, showing how to transition between strategies as positions are assigned or expire. The platform tracks the entire wheel lifecycle from initial put sale through potential assignment and subsequent call writing.
Volatility Regime Analysis
Traders can use VolRadar to analyze the current volatility regime and adjust their trading approach accordingly. The Weather Score history chart shows the 60-day trend, helping traders identify whether conditions are improving or deteriorating for premium selling. When the score is consistently above 65, traders can sell premium broadly across top candidates. When scores fluctuate between 40 and 64, traders become more selective, focusing only on high-edge setups. During defensive periods below 40, traders may reduce position sizes, shorten durations, or switch to long volatility strategies entirely.
Pricing
VolRadar offers two pricing tiers: a Free tier and a Starter plan at $19 per month. The Free tier includes the Weather Score, four calculators, and a basic scanner showing the top 5 candidate tickers, with one free full ticker report per day. No credit card is required for the Free tier. The Starter plan at $19 per month unlocks the full scanner with all 500+ tickers, the daily pre-market brief, computed strikes for any ticker, up to three ranked strategies per name, weekly trade ideas, and earnings risk gates. The platform does not offer annual billing discounts based on available information. The methodology behind all calculations is publicly available at volradar.com/methodology for transparency.
Frequently Asked Questions
What data sources does VolRadar use and how often is data updated?
VolRadar pulls end-of-day options data from ORATS, CBOE, and S&P 500 indices. Data is updated daily after US market close, typically by 6 PM ET. The platform processes over 500 US stocks and major ETFs, running the data through proprietary models to generate the Weather Score, IV Rank, VRP, computed strikes, and earnings crush projections. The 252-day lookback for IV Rank ensures historical context, while VRP calculations use 20-day realized volatility compared to 30-day implied volatility.
What is included in the free tier versus the Starter plan?
The free tier provides access to the Weather Score, four calculators, and a basic scanner that shows the top 5 candidate tickers. Users can view one full ticker report per day, including VRP, IV Rank, earnings risk, and strategy ranking. The Starter plan at $19 per month unlocks the full scanner with all 500+ tickers, the daily pre-market brief, computed strikes for any ticker, up to three ranked strategies per name, weekly trade ideas, and earnings risk gates. No credit card is required for the free tier.
How is the Weather Score calculated and what do different ranges mean?
The Weather Score is a composite of five factors: Premium Edge, VIX, Vol Trend, Earnings Safety, and Term Structure. Each factor is scored and weighted to produce a 0 to 100 final score. A score of 65 or higher (green) indicates favorable conditions where options are overpriced and traders can sell premium broadly across top candidates. Scores between 40 and 64 (yellow) suggest selective trading where only high-edge setups should be considered. Scores below 40 (red) indicate defensive conditions where traders should stand aside or significantly reduce position sizes.
Can I use VolRadar for stocks outside the S&P 500?
VolRadar currently covers over 500 US stocks and major ETFs that are part of the S&P 500 universe. The platform does not support stocks outside this universe, penny stocks, or options on indices directly. The focus on S&P 500 names ensures deep liquidity, reliable options pricing, and consistent data quality from ORATS. Traders seeking analysis on smaller cap stocks or non-US equities would need to look at alternative platforms, though VolRadar's S&P 500 coverage includes the most actively traded options names in the market.
Similar to VolRadar

Bullynx
Bullynx analyzes chart screenshots and market questions to deliver structured trade bias and invalidating levels in seconds.
iPulse
iPulse delivers AI-driven market intelligence with real-time forecasts, risk signals, and analytics across global assets for strategic.
TryBit
TryBit is a crypto payment gateway processing over 40 cryptocurrencies with a 0.4% commission, volatility protection, and customizable checkout pages.

helpdol
Helpdol is an AI-powered finance tool enabling voice expense tracking, receipt capture, and real-time forecasting for independent contractors.

Postservice.at
Postservice.at provides a legally valid Vienna business address with mail scanning for virtual office needs starting at 49 euros monthly.
SeasonalVantage
SeasonalVantage combines a 90%+ win-rate seasonality database with curated options flow and a Telegram screener to identify high-probability stock.
EmLedger
EmLedger offers unified multi-entity accounting with real double-entry systems for a flat fee, eliminating per-entity charges.

Notesnchat
NotesnChat is an all-in-one productivity app that combines task management, note-taking, reminders, and communication for seamless organization.