tool Details
Explore More
Alternatives
About LoadTester
LoadTester is a modern HTTP and API load testing tool built by Cloud Native d.o.o. for engineering teams that require repeatable performance checks without the overhead of managing infrastructure. It is designed for developers, QA engineers, and site reliability engineers who need to validate application performance under load, catch regressions before they reach production, and maintain service level objectives with confidence. The core value proposition is simplicity: create a test, choose virtual users or requests per second as your load model, monitor live latency and error rates during execution, and review completed results with run-to-run comparisons. LoadTester eliminates the need to provision servers, configure worker pools, or manage distributed testing infrastructure. It supports distributed load tests from a browser or CI/CD pipeline, with live analytics, p95 and error rate thresholds, scheduled baselines, and comprehensive result exports. The platform achieves a cold start to first request time of under three seconds, supports up to 10,000 maximum virtual users per test, and delivers a typical run success rate of 99.8 percent. Built for scale, performance, and reliability, LoadTester provides API access, webhooks, Slack and email alerts, and workflow integrations for teams that want simple, repeatable performance checks integrated into their development lifecycle.
Features
Instant Execution and Distributed Workers
LoadTester starts distributed load tests in seconds with no infrastructure setup required. The platform auto-scales workers based on test requirements, dispatching up to eight workers for concurrent execution. Cold start time is under three seconds from test creation to first request being sent. There is no queue time for test initiation, and the system handles worker orchestration, infrastructure coordination, and execution flow automatically. This allows teams to focus on analyzing results rather than managing testing infrastructure.
Live Real-Time Analytics
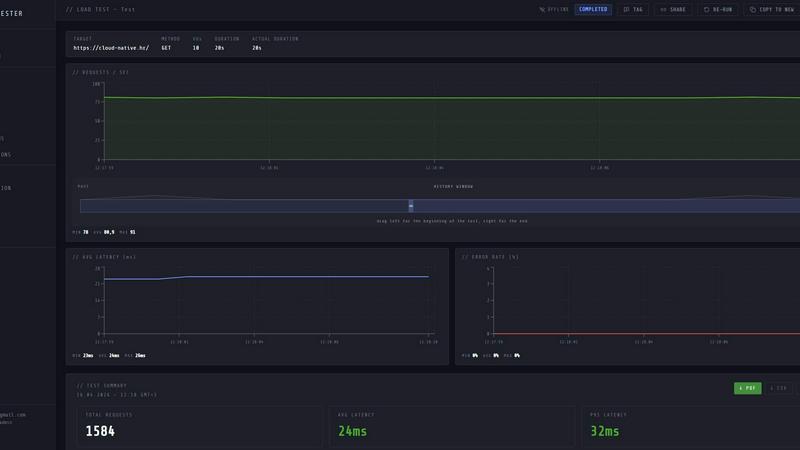
During test execution, LoadTester provides live streaming telemetry including requests per second, p50, p95, and p99 latency metrics, error counts, and active virtual user counts. The live charts update continuously during the run rather than showing results five minutes after completion. Engineers can observe throughput, latency distribution, and failure rates in real time, enabling immediate detection of performance anomalies and bottlenecks as they occur during the test window.
Smart Auto-Stop with Threshold Guardrails
LoadTester enables teams to set failure and latency thresholds that automatically stop tests when predefined conditions are breached. Users configure p95 latency limits, error rate percentages, and regression comparisons against baseline runs. When a threshold is breached, the system can auto-stop the test, notify Slack and email contacts, and trigger webhooks for downstream automation. This prevents wasted compute resources and ensures that performance regressions are caught immediately.
CI/CD Integration and Automation
LoadTester is fully CI/CD ready with API access, webhooks, and workflow integrations. Teams can run tests on every deploy, integrate with release pipelines, and automate performance validation as part of their continuous delivery process. The platform supports scheduled tests for nightly baselines, webhook completion hooks to post result links to release bots, and comprehensive result exports in PDF, CSV, and JSON formats for integration with reporting tools and dashboards.
Use Cases
Pre-Deployment Performance Validation
Engineering teams can integrate LoadTester into their CI/CD pipelines to run automated performance tests before every production deployment. By setting p95 latency and error rate thresholds, teams can automatically gate releases that would introduce performance regressions. The instant execution model allows tests to complete within minutes, providing rapid feedback without delaying deployment cycles. This use case is critical for teams deploying multiple times per day who need to maintain consistent performance service level objectives.
Spike Testing for E-Commerce and High-Traffic Applications
E-commerce platforms and applications with variable traffic patterns can use LoadTester to simulate checkout spikes, flash sales, or promotional events. The ability to configure up to 10,000 virtual users and 10,000 requests per second allows teams to validate that their infrastructure can handle peak load scenarios. Live analytics during the test reveal how latency distributions shift under increasing concurrency, while threshold guardrails automatically stop tests if error rates exceed acceptable levels during the spike simulation.
Baseline Monitoring and Regression Detection
Teams can schedule nightly baseline tests to establish performance benchmarks for critical API endpoints. LoadTester supports run-to-run comparisons that automatically detect regressions against previous baselines. When a regression of 15 percent or more is detected, the system triggers Slack and email notifications. This use case is essential for SRE teams who need continuous performance monitoring and early warning of capacity degradation caused by code changes, configuration updates, or infrastructure modifications.
Multi-Environment Capacity Planning
Organizations managing staging, pre-production, and production environments can use LoadTester to run identical test scenarios across different environments for capacity planning. The export functionality in PDF, CSV, and JSON formats allows teams to share results with stakeholders and compare performance characteristics between environments. Distributed worker execution ensures that tests can generate sufficient load to validate infrastructure scaling behavior, identify bottlenecks, and inform resource allocation decisions before major releases.
Pricing
LoadTester offers a free plan that provides access to core functionality including distributed load tests, live analytics, and basic threshold configuration. The free plan is designed for individual developers and small teams who want to evaluate the platform or run occasional performance tests. For teams requiring higher concurrency limits, longer test durations, advanced automation features, and priority support, LoadTester offers paid plans with tiered pricing based on usage volume and feature requirements. Specific pricing details for paid plans are available on the LoadTester website under the pricing section, and users can start with the free plan and upgrade as their performance testing needs grow.
Frequently Asked Questions
How does LoadTester handle infrastructure scaling for distributed load tests?
LoadTester automatically manages worker scaling and infrastructure coordination without any manual setup from the user. When a test is initiated, the platform dispatches workers based on the configured load parameters, supporting up to eight concurrent workers per test. The system handles worker orchestration, execution flow, and result aggregation. Cold start time is under three seconds from test creation to first request, and there is no queue time for test initiation. Users do not need to provision servers, configure load generators, or manage any underlying infrastructure.
What latency metrics and percentiles does LoadTester report during live test execution?
LoadTester provides real-time streaming of p50, p95, and p99 latency metrics during test execution, displayed on live charts that update continuously throughout the run. The latency distribution visualization shows how response times change over the last 60 seconds of the test. After completion, the summary includes total requests, average latency, p95 latency, data sent, and data received. These metrics enable engineers to identify performance bottlenecks and validate service level objectives during the test rather than waiting for post-run analysis.
Can LoadTester automatically stop tests when performance thresholds are breached?
Yes, LoadTester includes a smart auto-stop feature that allows users to configure threshold guardrails for p95 latency, error rate percentages, and regression comparisons against baseline runs. When a threshold is breached, the system can automatically stop the test execution, preventing wasted compute resources and ensuring immediate notification of performance issues. The platform also supports webhook triggers on completion and can send alerts via Slack and email when thresholds are violated, enabling rapid response to performance regressions.
What export formats and integration options are available for test results?
LoadTester supports result exports in PDF, CSV, and JSON formats, allowing teams to share performance data with stakeholders or integrate into existing reporting tools. The platform provides a full API for programmatic access, webhooks for triggering downstream workflows, and direct integrations with Slack and email for notifications. Scheduled tests can be configured for nightly baselines, and completion hooks can post result links to release bots or other automation systems. These integration options make it straightforward to incorporate performance testing into existing development and operations workflows.
Similar to LoadTester
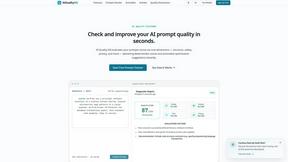
AIQualityHQ
AIQualityHQ provides deterministic evaluations across six prompt quality dimensions with instant scores and actionable fixes.
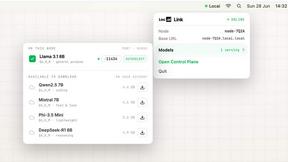
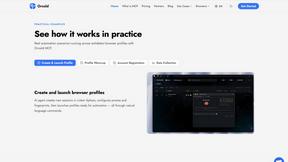
Locai
Locai lets you run powerful AI models on your own hardware, keeping data private and cutting cloud costs.

Best Face Swap
Best Face Swap offers a dedicated video and photo AI workflow for frame-consistent face replacement with reserved API access.
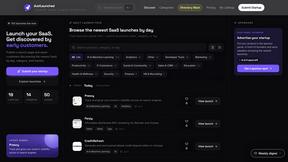
JustLaunched
JustLaunched schedules your SaaS launch, submits to curated directories, and connects you with buyers discovering new tools daily.